

Year:
2024-2026
Responsibilities:
Research
UX Design
UI Design


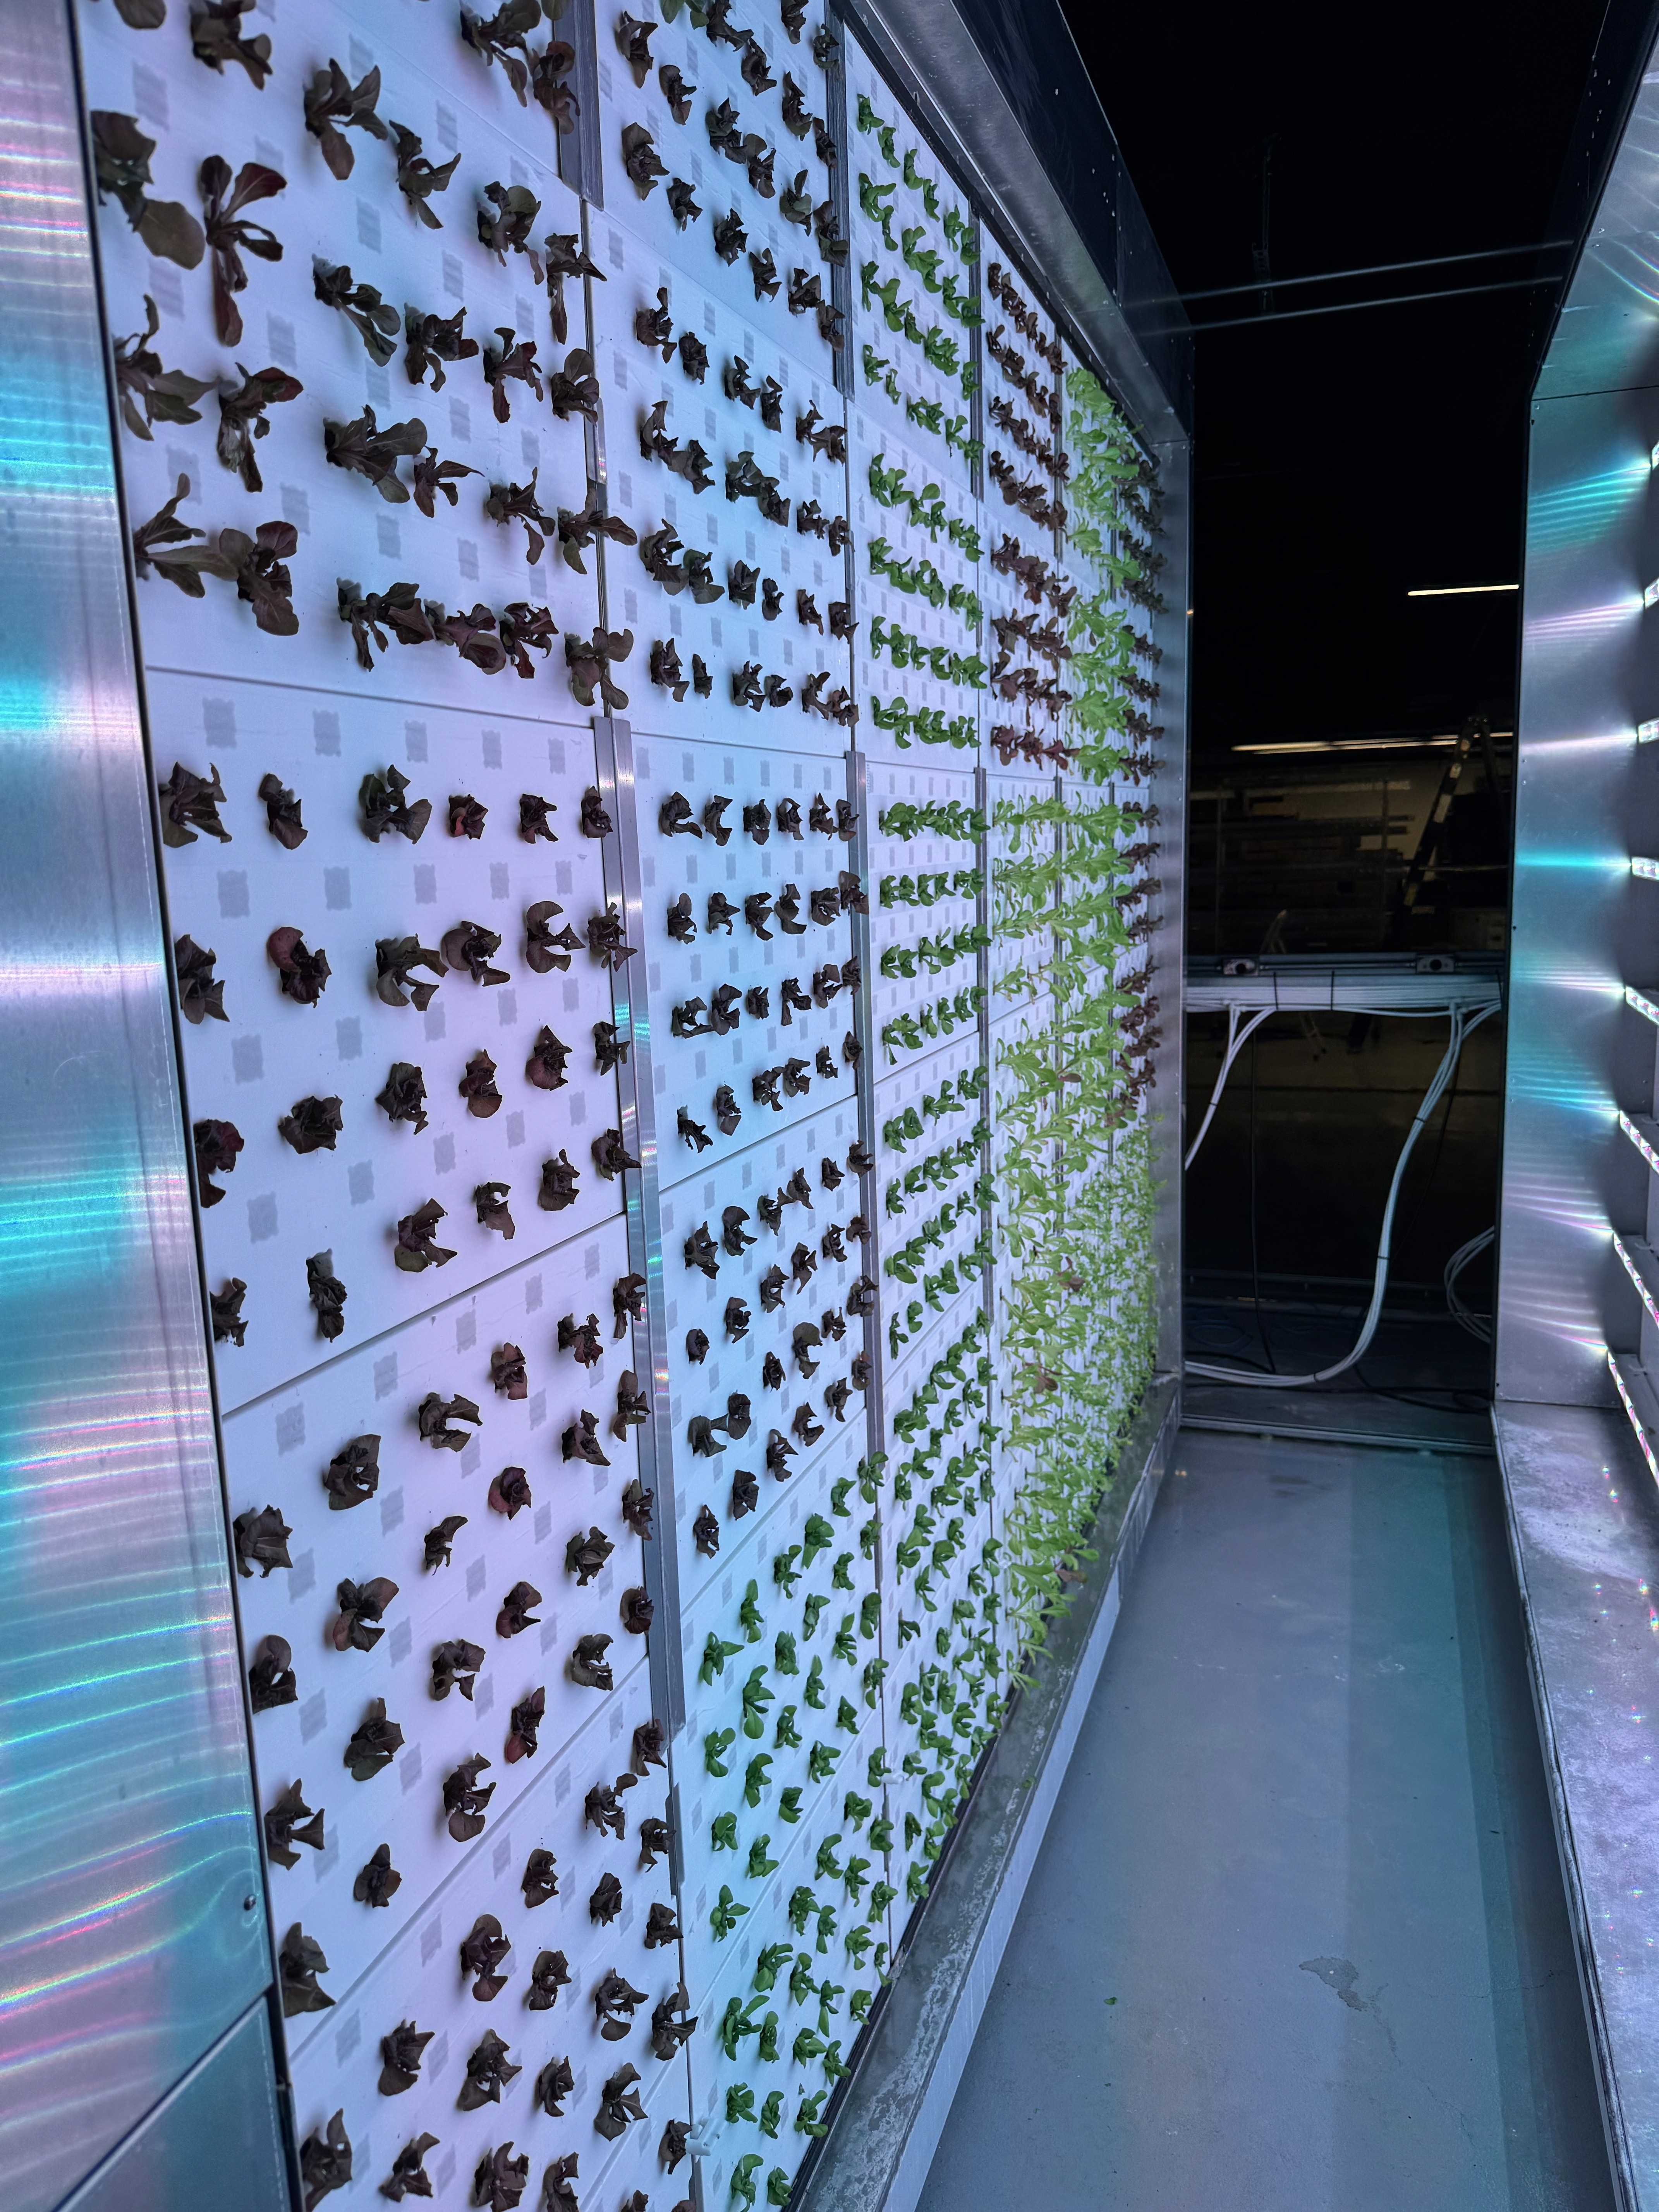
What is the CRCLR system
The CRCLR system is a series of movable racks, a nutrient distribution system and a software that allows users to manage indoor farms. These farms operate year round controlling all possible environmental variables such as temperature, nutrients, humidity, light levels & more.
Phase 1
Growing
Create a user friendly tool to allow more to become familiar with the system
Phase 2
Profitability
Build out the recipe marketplace to sell proven successful recipes. Lower the barriers to entry based on skill.
Phase 3
Automation
Once sufficient user data is collected, automatically generate custom recipes
A plant's environmental conditions affect the resulting yields in controllable ways.
Plants respond strongly to environmental stimuli, the conditions in which a plant is raised has a tangible effect on their size, taste, longevity and growth speed. For example, if a strawberry plant is exposed to colder conditions during night cycles, it will respond with a higher sugar content resulting in sweeter berries when harvested.
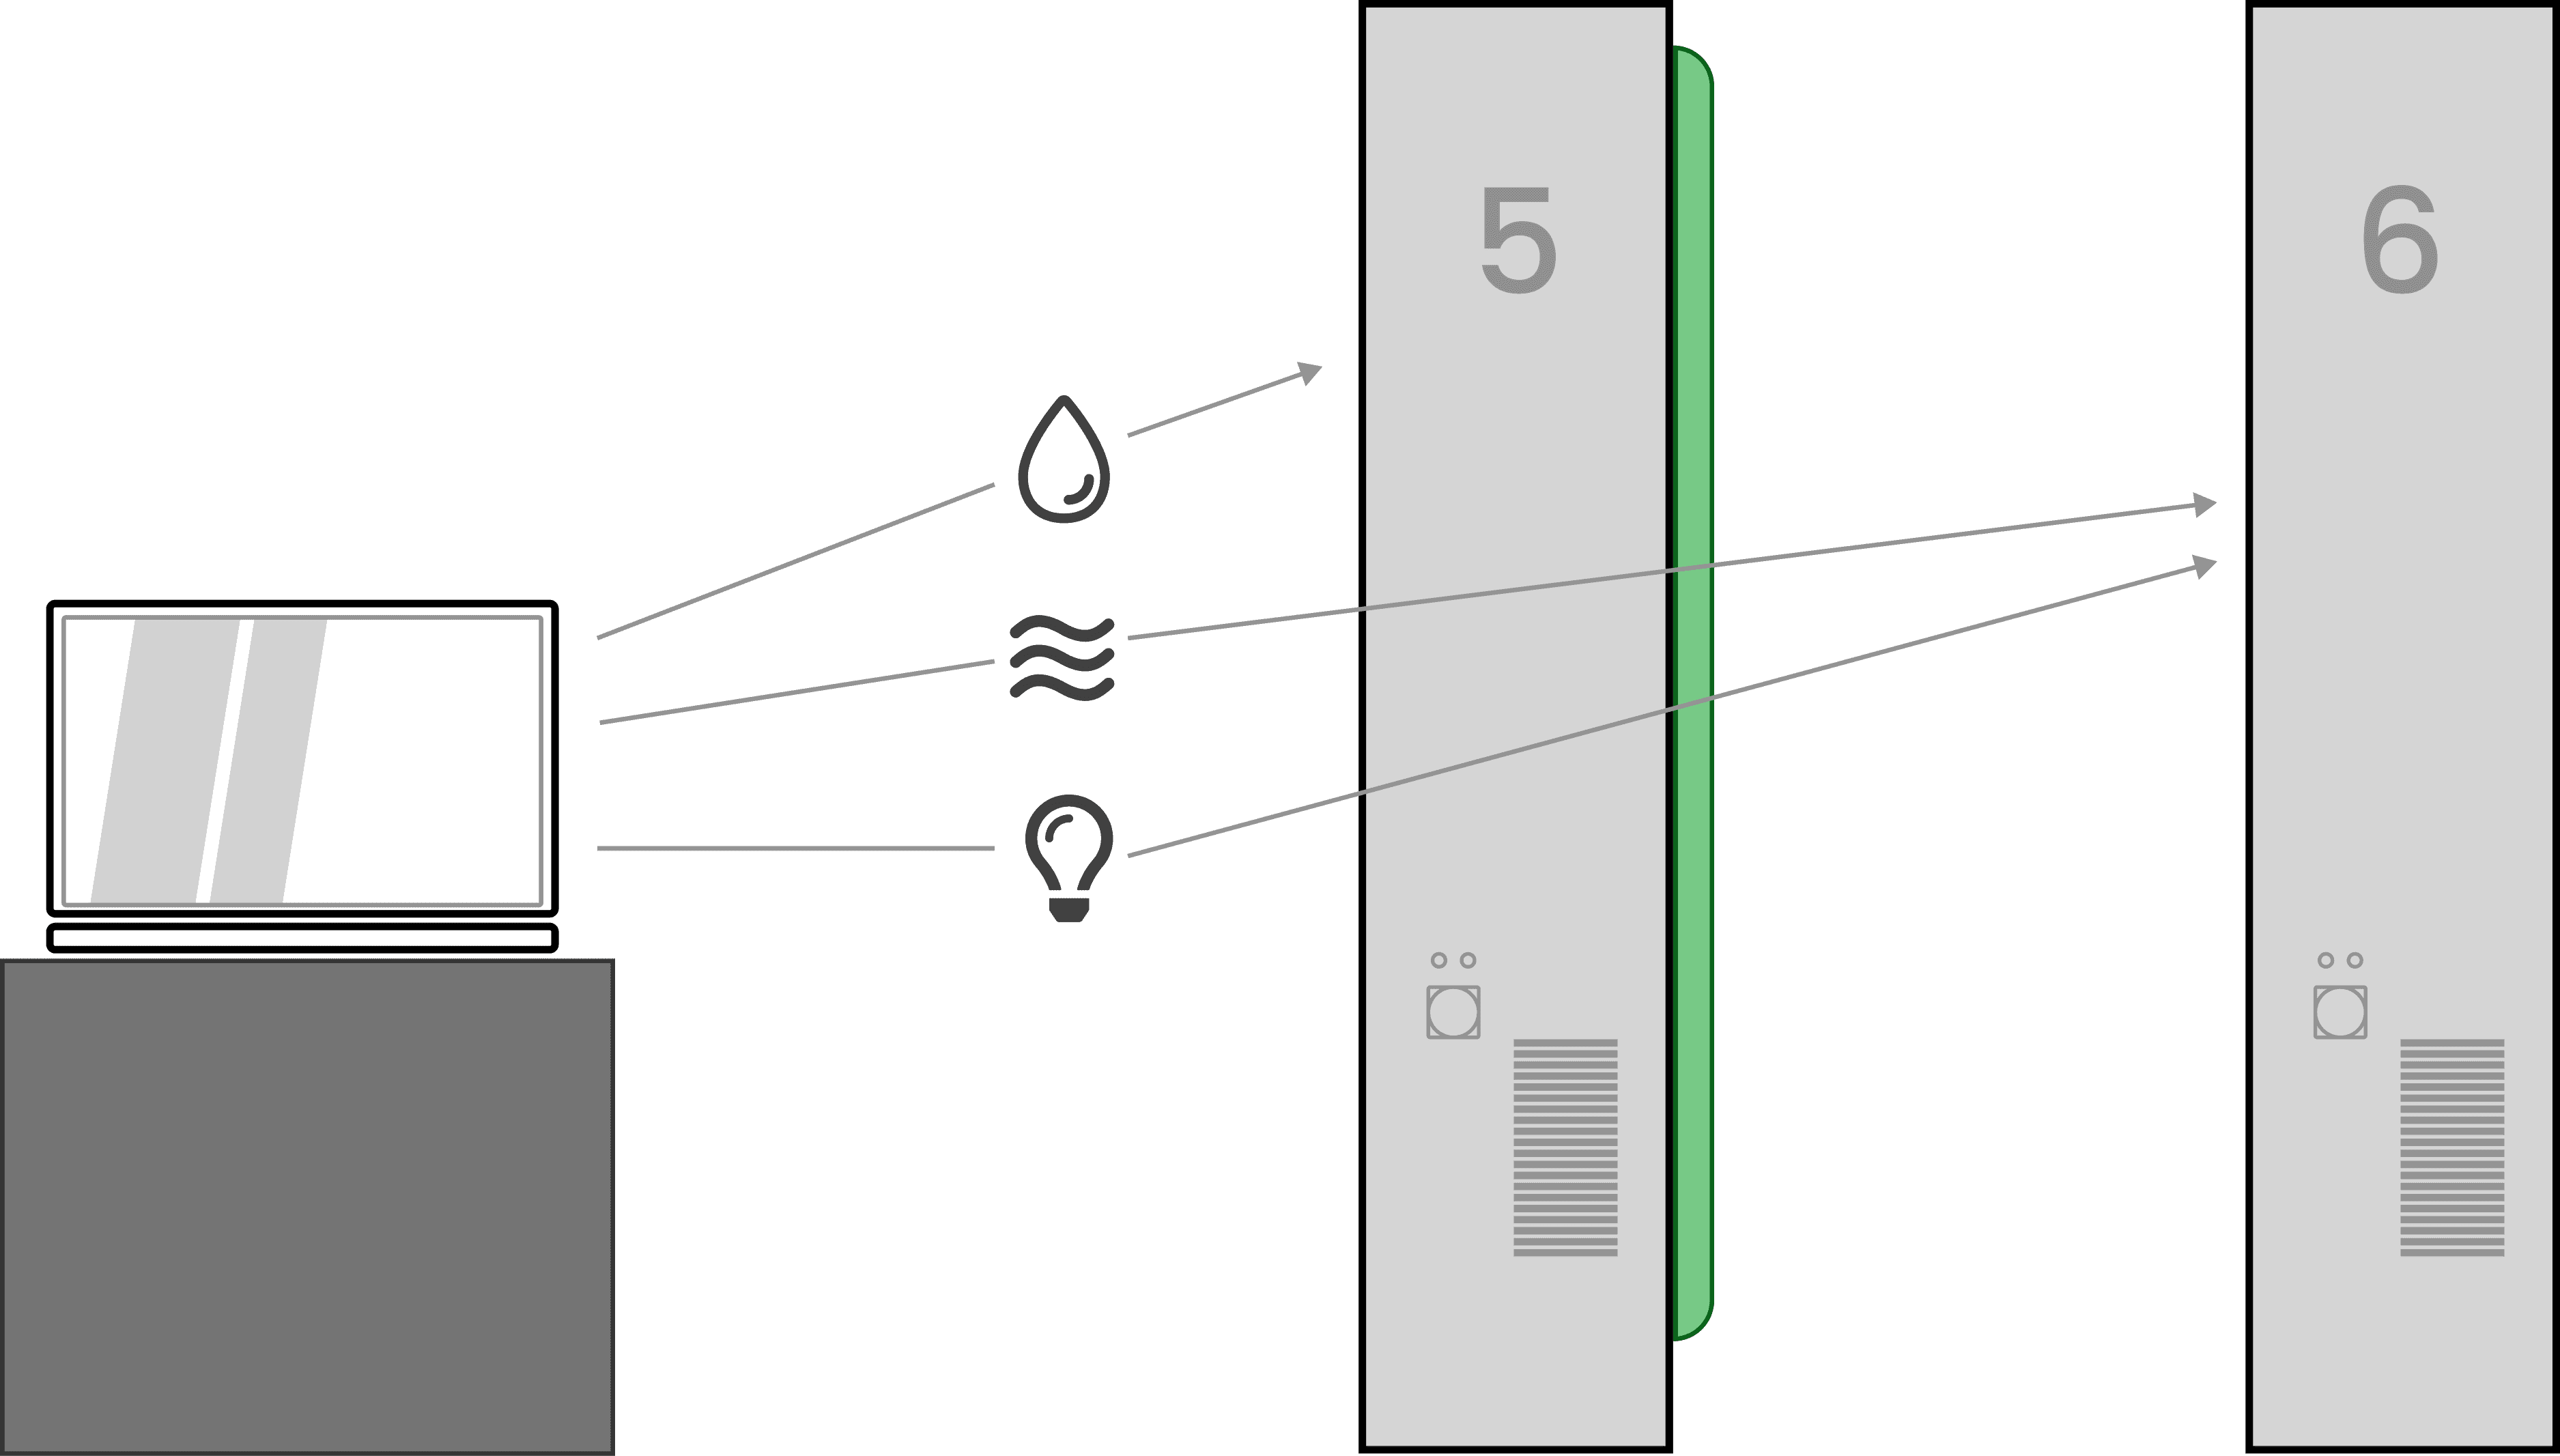
How we implement this within our system
Plants respond strongly to environmental stimuli, the conditions in which a plant is raised has a tangible effect on their size, taste, longevity and growth speed. For example, if a strawberry plant is exposed to colder conditions during night cycles, it will respond with a higher sugar content resulting in sweeter berries when harvested.
Water Temp
EC
pH
ORP
Spray Rate
Leaf Temp
Air Temp
VPD
Relative Humidity
Air Speed
CO2
Green Light
Red Light
Blue Light
Far Red Light
CLI
PPFD

It's important to consider growth stages when building recipes
Its also important to consider the life cycles of plants and how they affect growth. The needs of the plant during the sprouting stage will likely be different than the needs at a fruiting stage.
Its also important to consider day and night cycles of the plants, lighting for example has to be provided in phases, constant light will dy out the leaves.
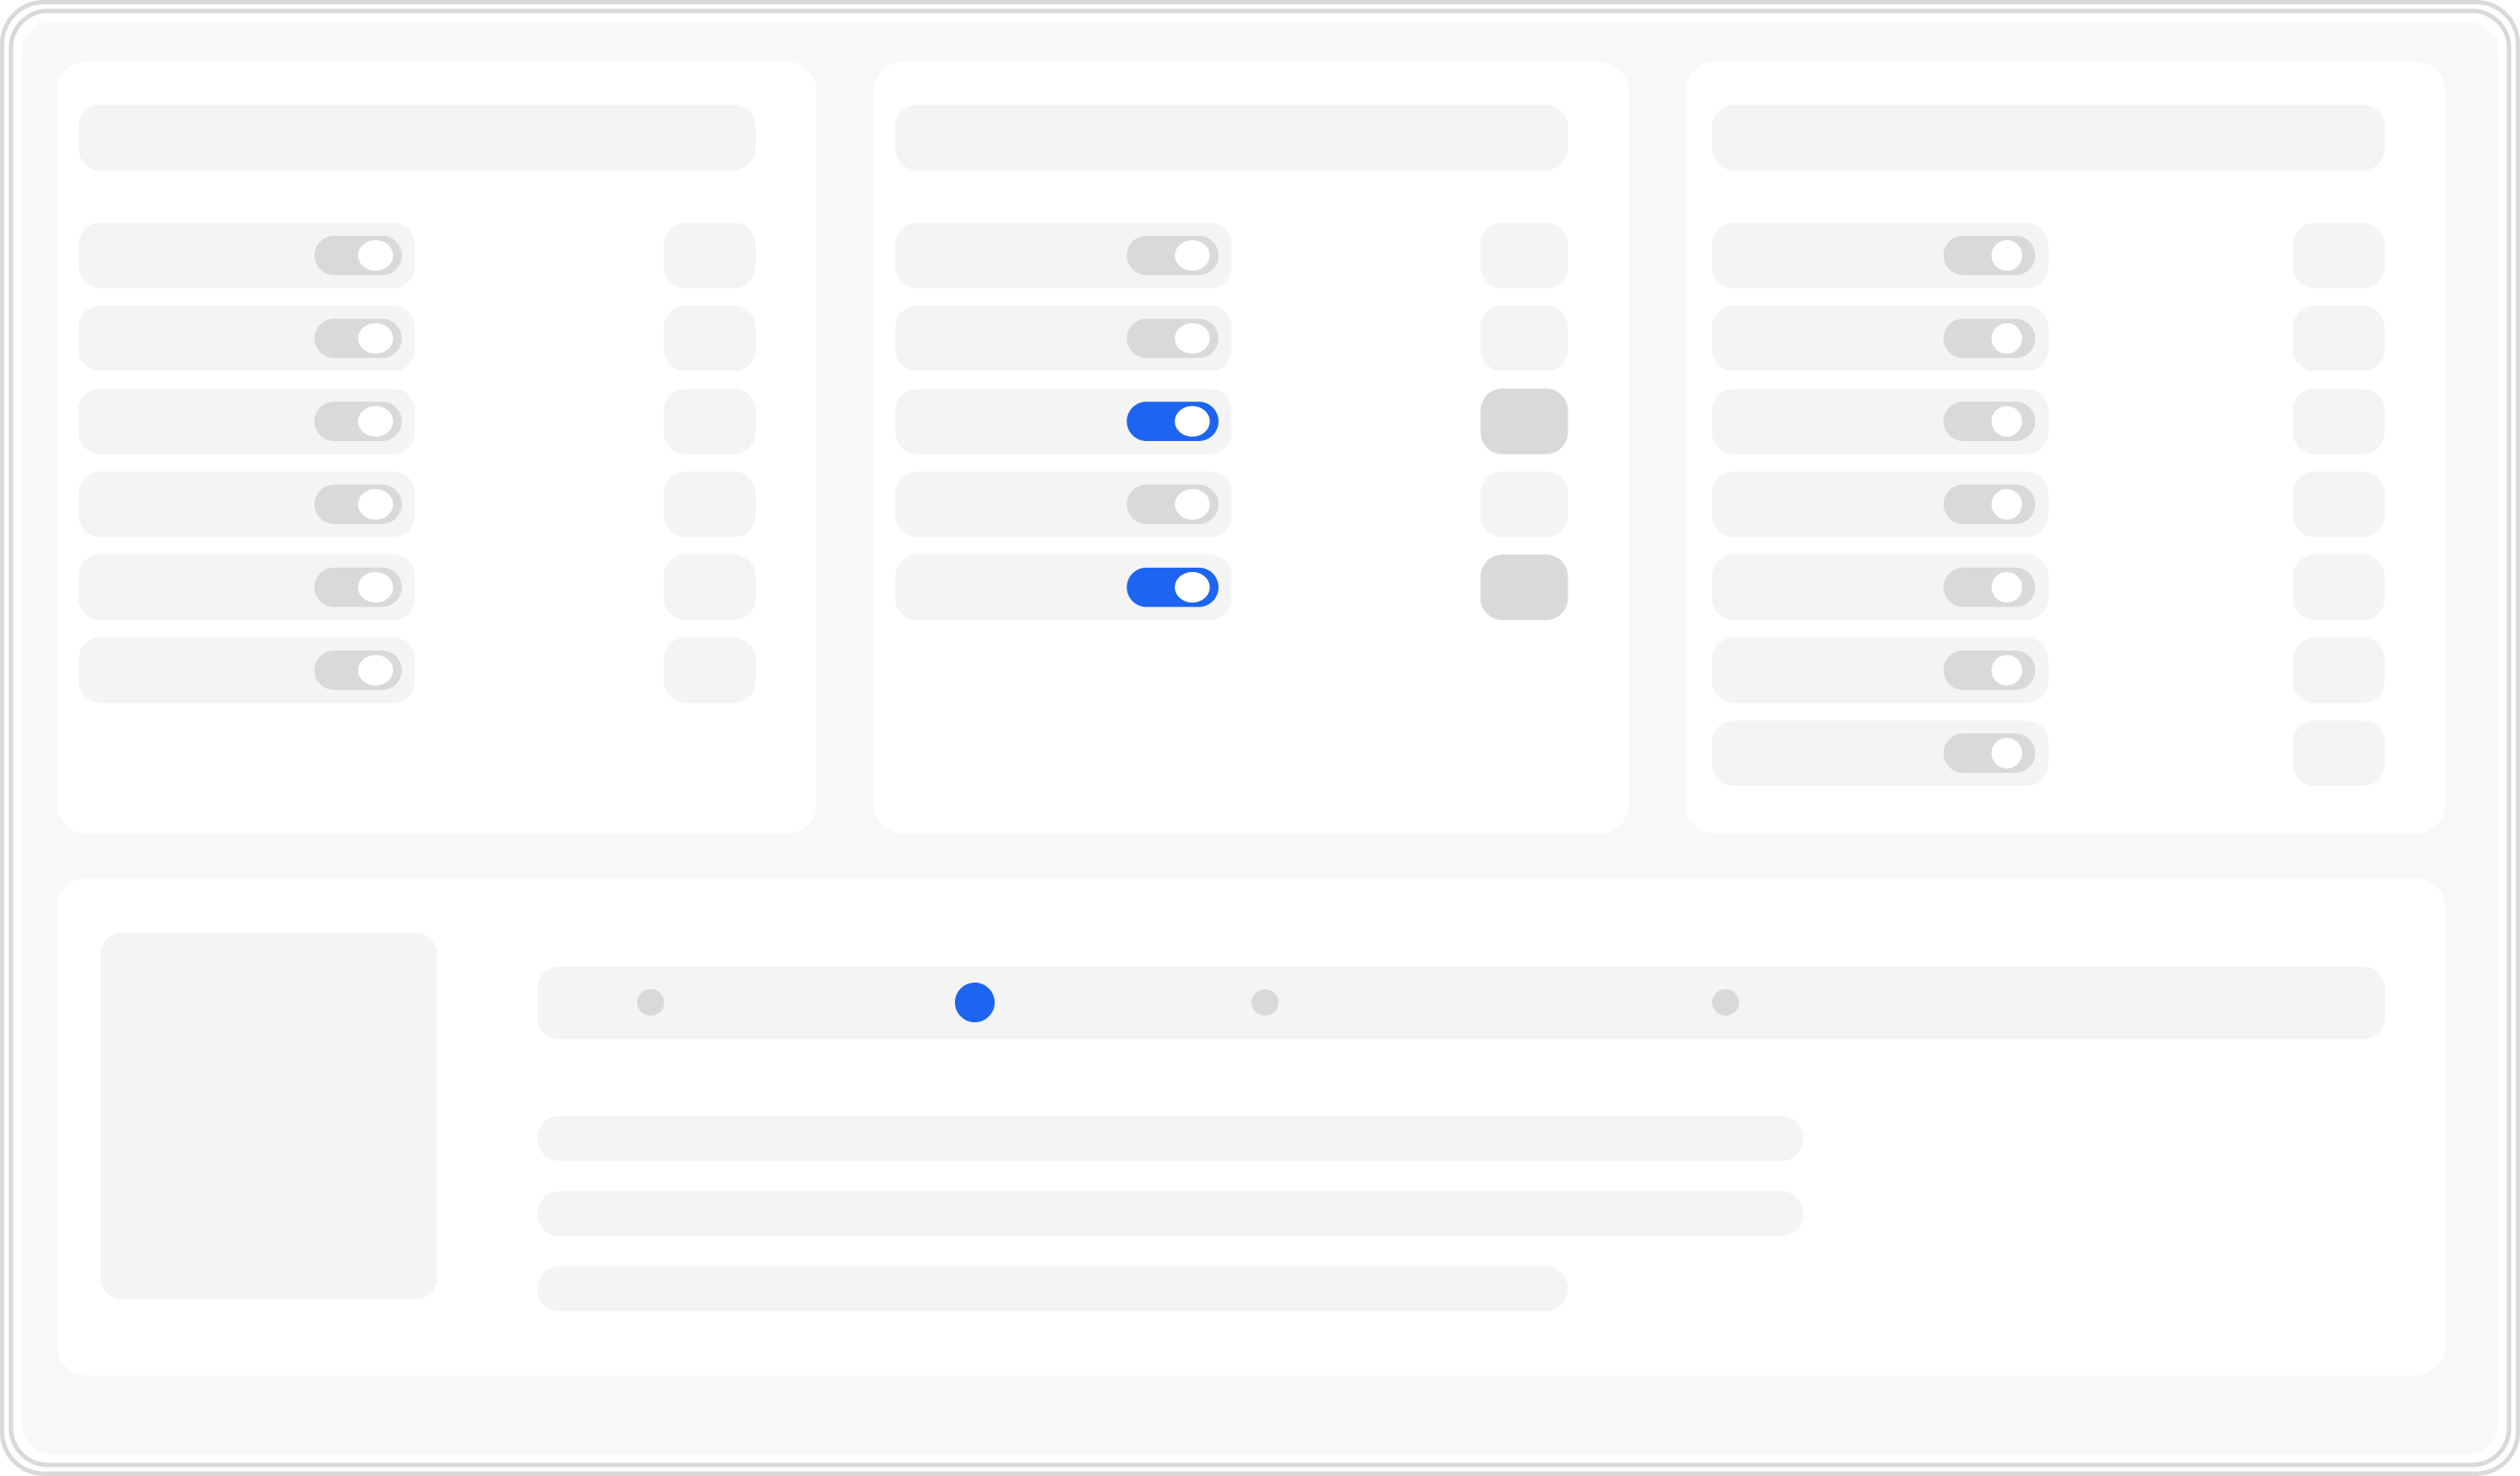
On/Off screen worked well for testing
First design concepts were based around the idea of setting all setpoints at a single instance on a timeline. This worked well for inital R & D testing but proved clunky when building recipes made to actually grow plants
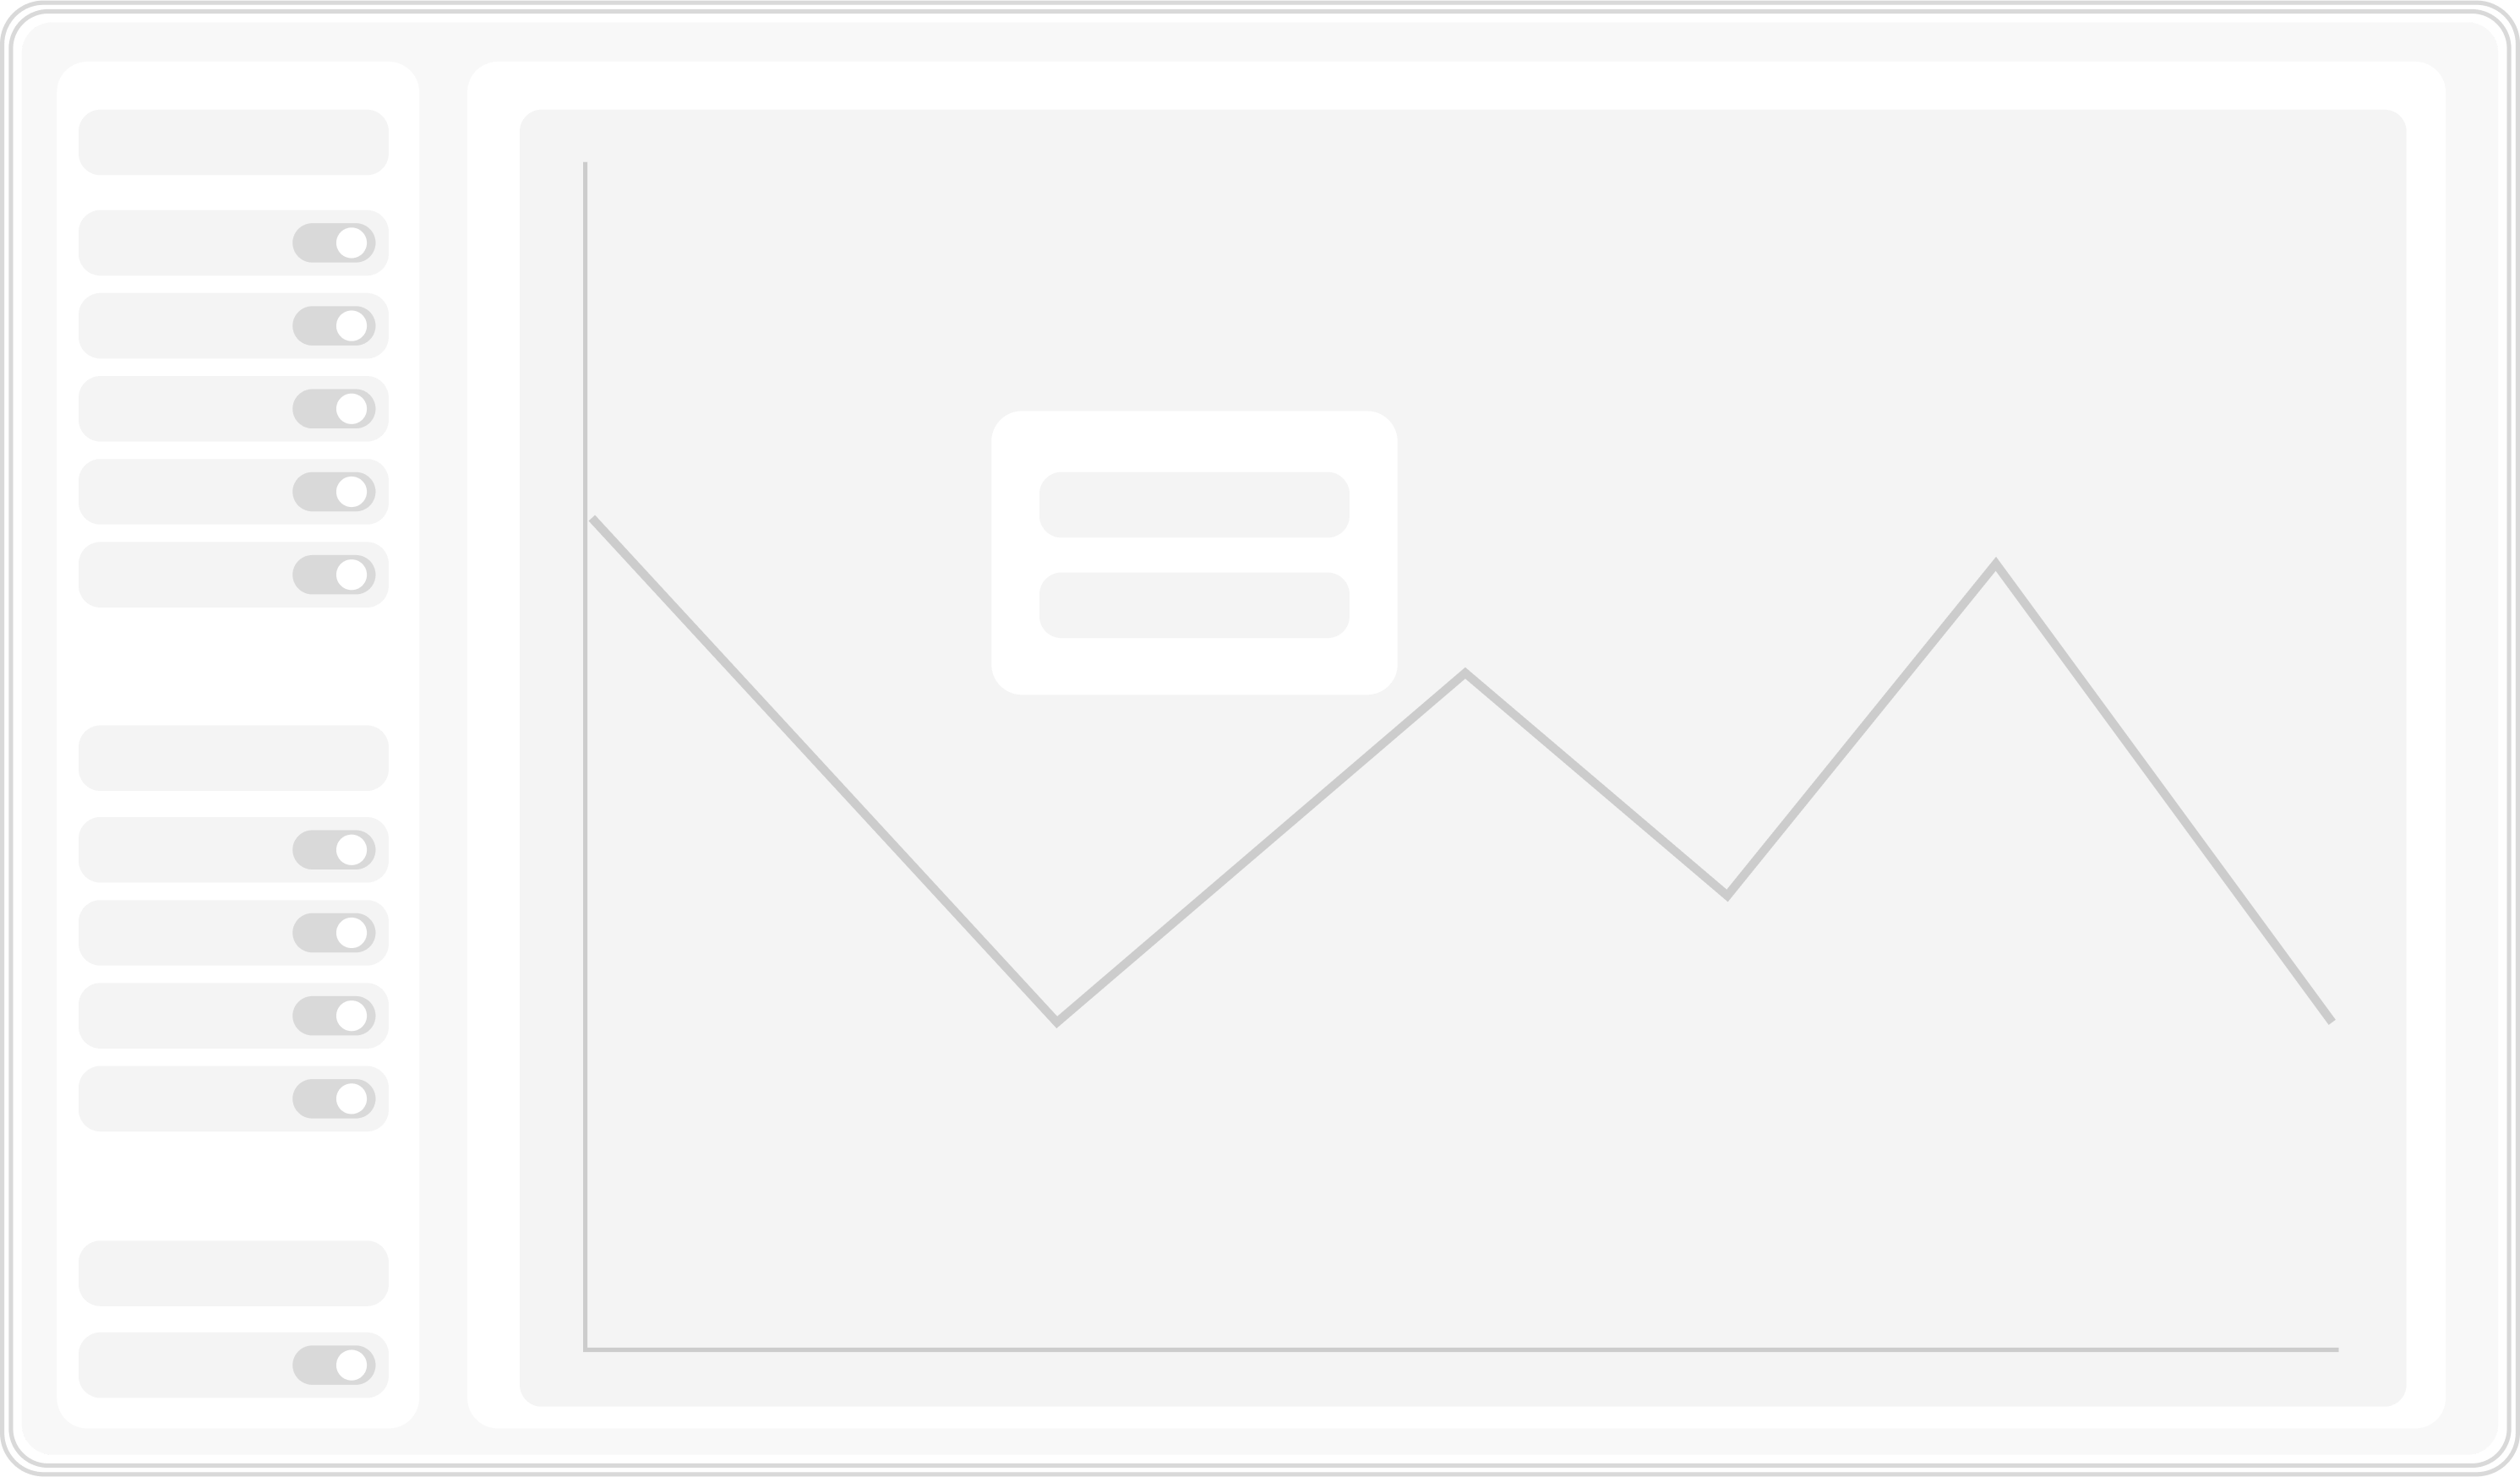
Graphed data provides a more accurate visual model
The preferred design included graphing the data over a repeating time frame. These cycles of either 12 or 24 hour periods let users create a day & night mode that ramps down quickly and easily.
Creating a recipe timeline
Before starting a grow, its important to clearly outline the stages of growth the plant will go through. Each of these cycles will have a unique repeating recipe for the duration decided. These timelines act as a foundation for building the recipe with variables.


Selecting a variable to change
After selecting a stage, users can manage the variables within a cycle, all graphed visually through lines on a chart. When a variable is selected, all of its inflection points can be manipulated and the Y axis will update to the related units. Small visual changes make it easy to know which variable is being selected.
A setpoint can be added by clicking the button in the top right followed by its place on the graph. When setpoints are dragged, the pop up only display the time and value associated until it’s let go to make the placement more accurate.

Precisely managing setpoint values
The pop ups provide more detailed ability to manipulate the values and line types. Depending on the setpoint you can modify the point’s value (y axis), timing (x axis) or line type.

Managing lighting setpoints with sliders
Lighting setpoints are more complex and controlled by sliders. The ratios are connected so increasing one light spectrum will have an inverse effect on all of the others. The overall intensity is managed through the master line above.
Phase 1
Growing
Create a user friendly tool to allow more to become familiar with the system
Phase 2
Profitability
Build out the recipe marketplace to sell proven successful recipes. Lower the barriers to entry based on skill.
Phase 3
Automation
Once sufficient user data is collected, automatically generate custom recipes

New opportunities: Machine learning recipe creation
As the user base grows, the plan is to incorporate machine learning into recipe builders. With enough data, we can generate recipes through simple real life inputs like size, sweetness, colour and growth speed. Ideally this will lower the barrier to entry and expose small scale controlled farming to a whole new customer base.
How did we do?
Wins: Strong exploration
Once trained, farmers were quite excited to experiment with the new tools.
Fail: Steep learning curve
Teaching farmers to use the tool was farm more difficult than planned. More thorough tutorials will be needed in the future to address this.
200+
New recipes created in the first month
10%
Increase in yields in the first 6 months
Previous
Next