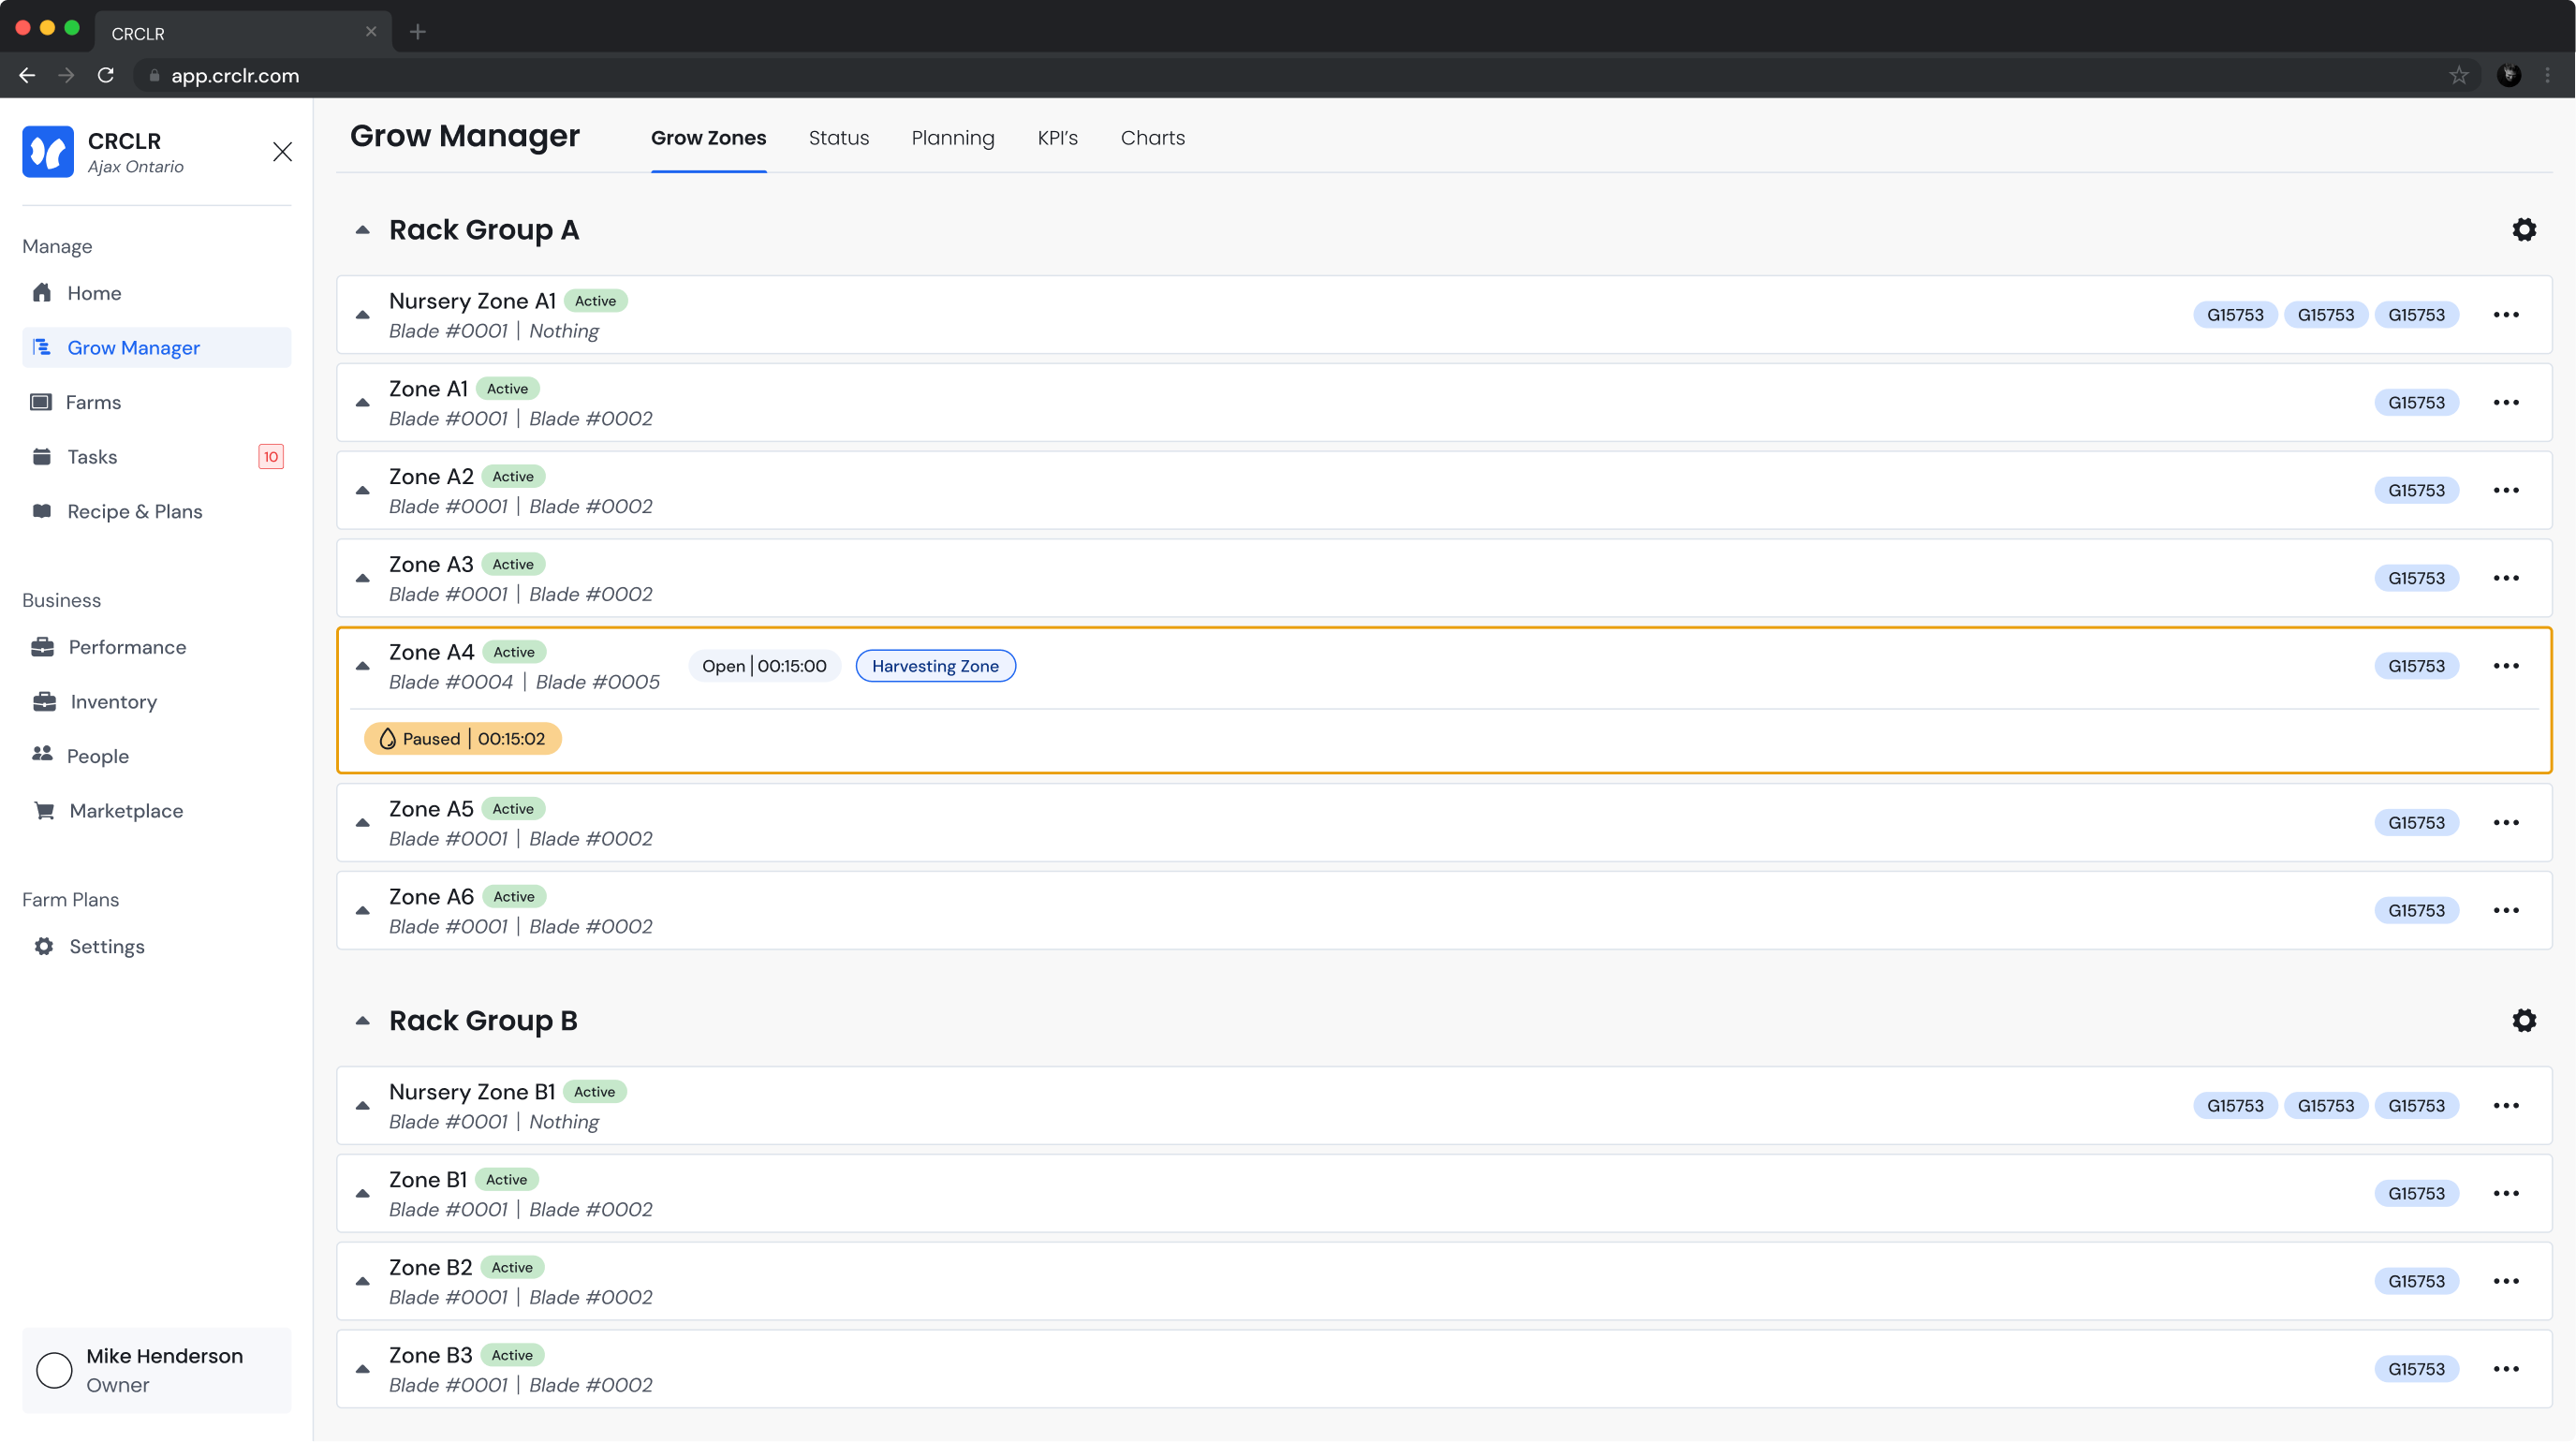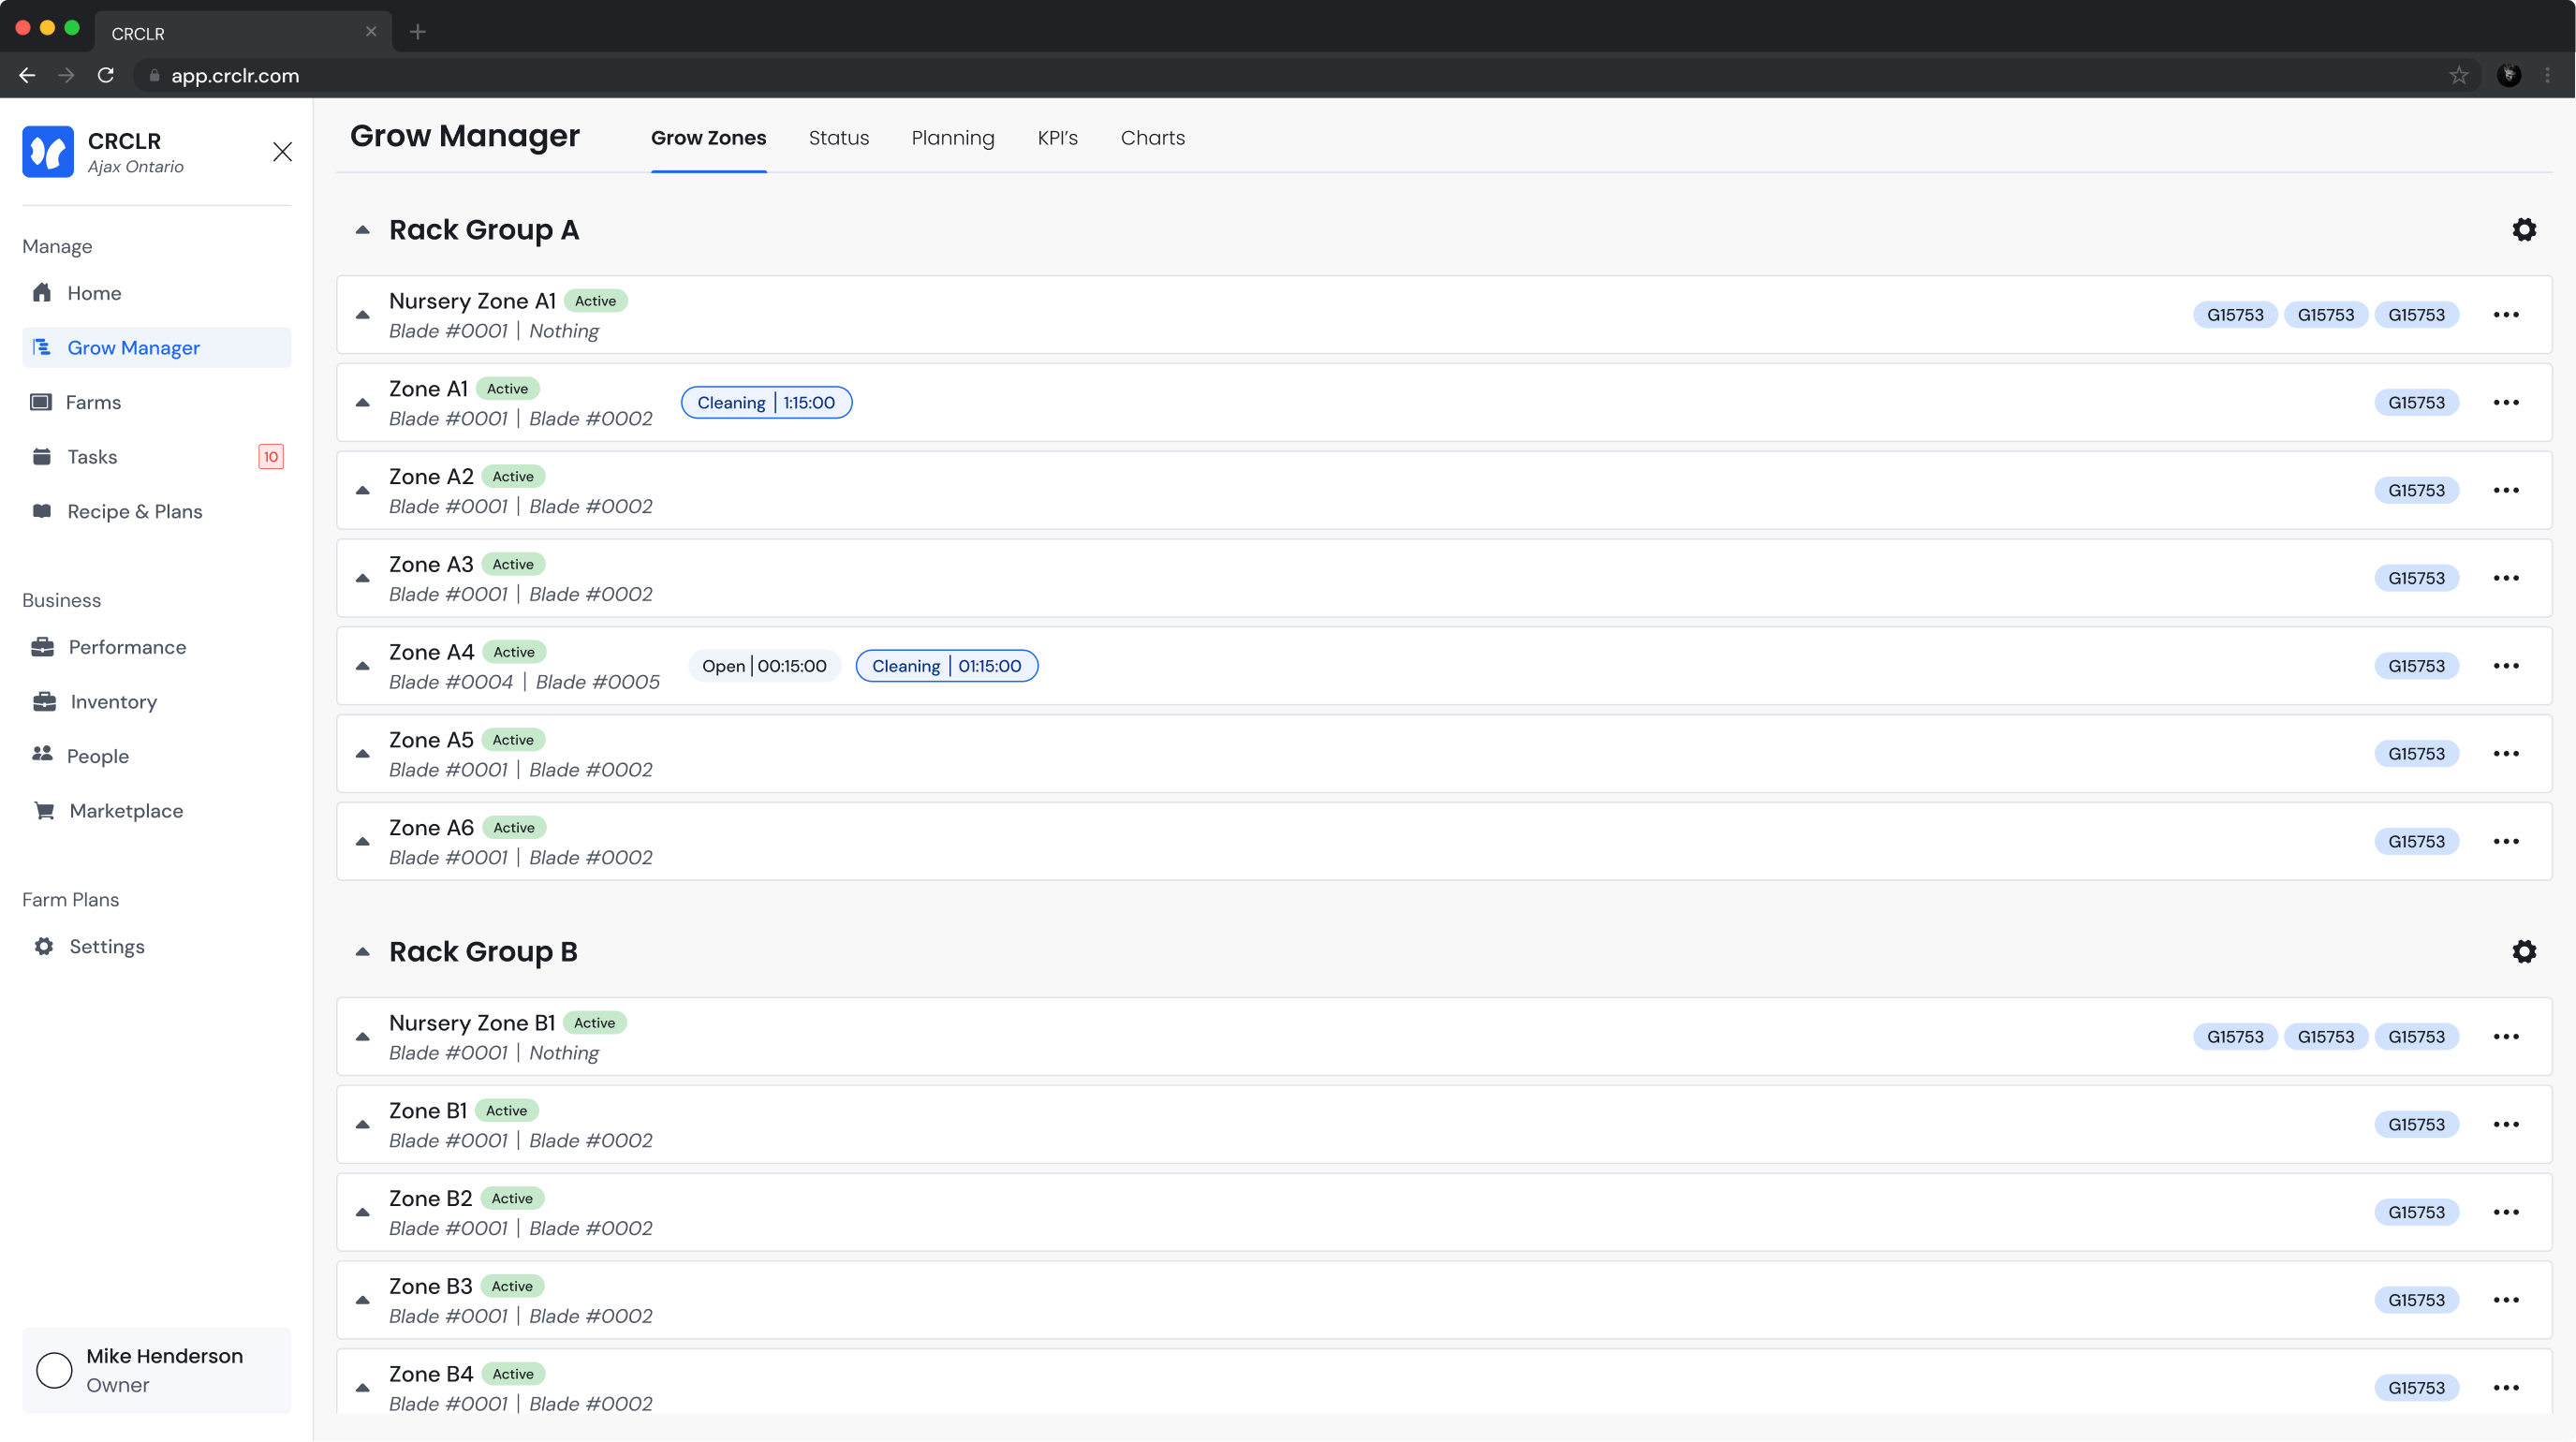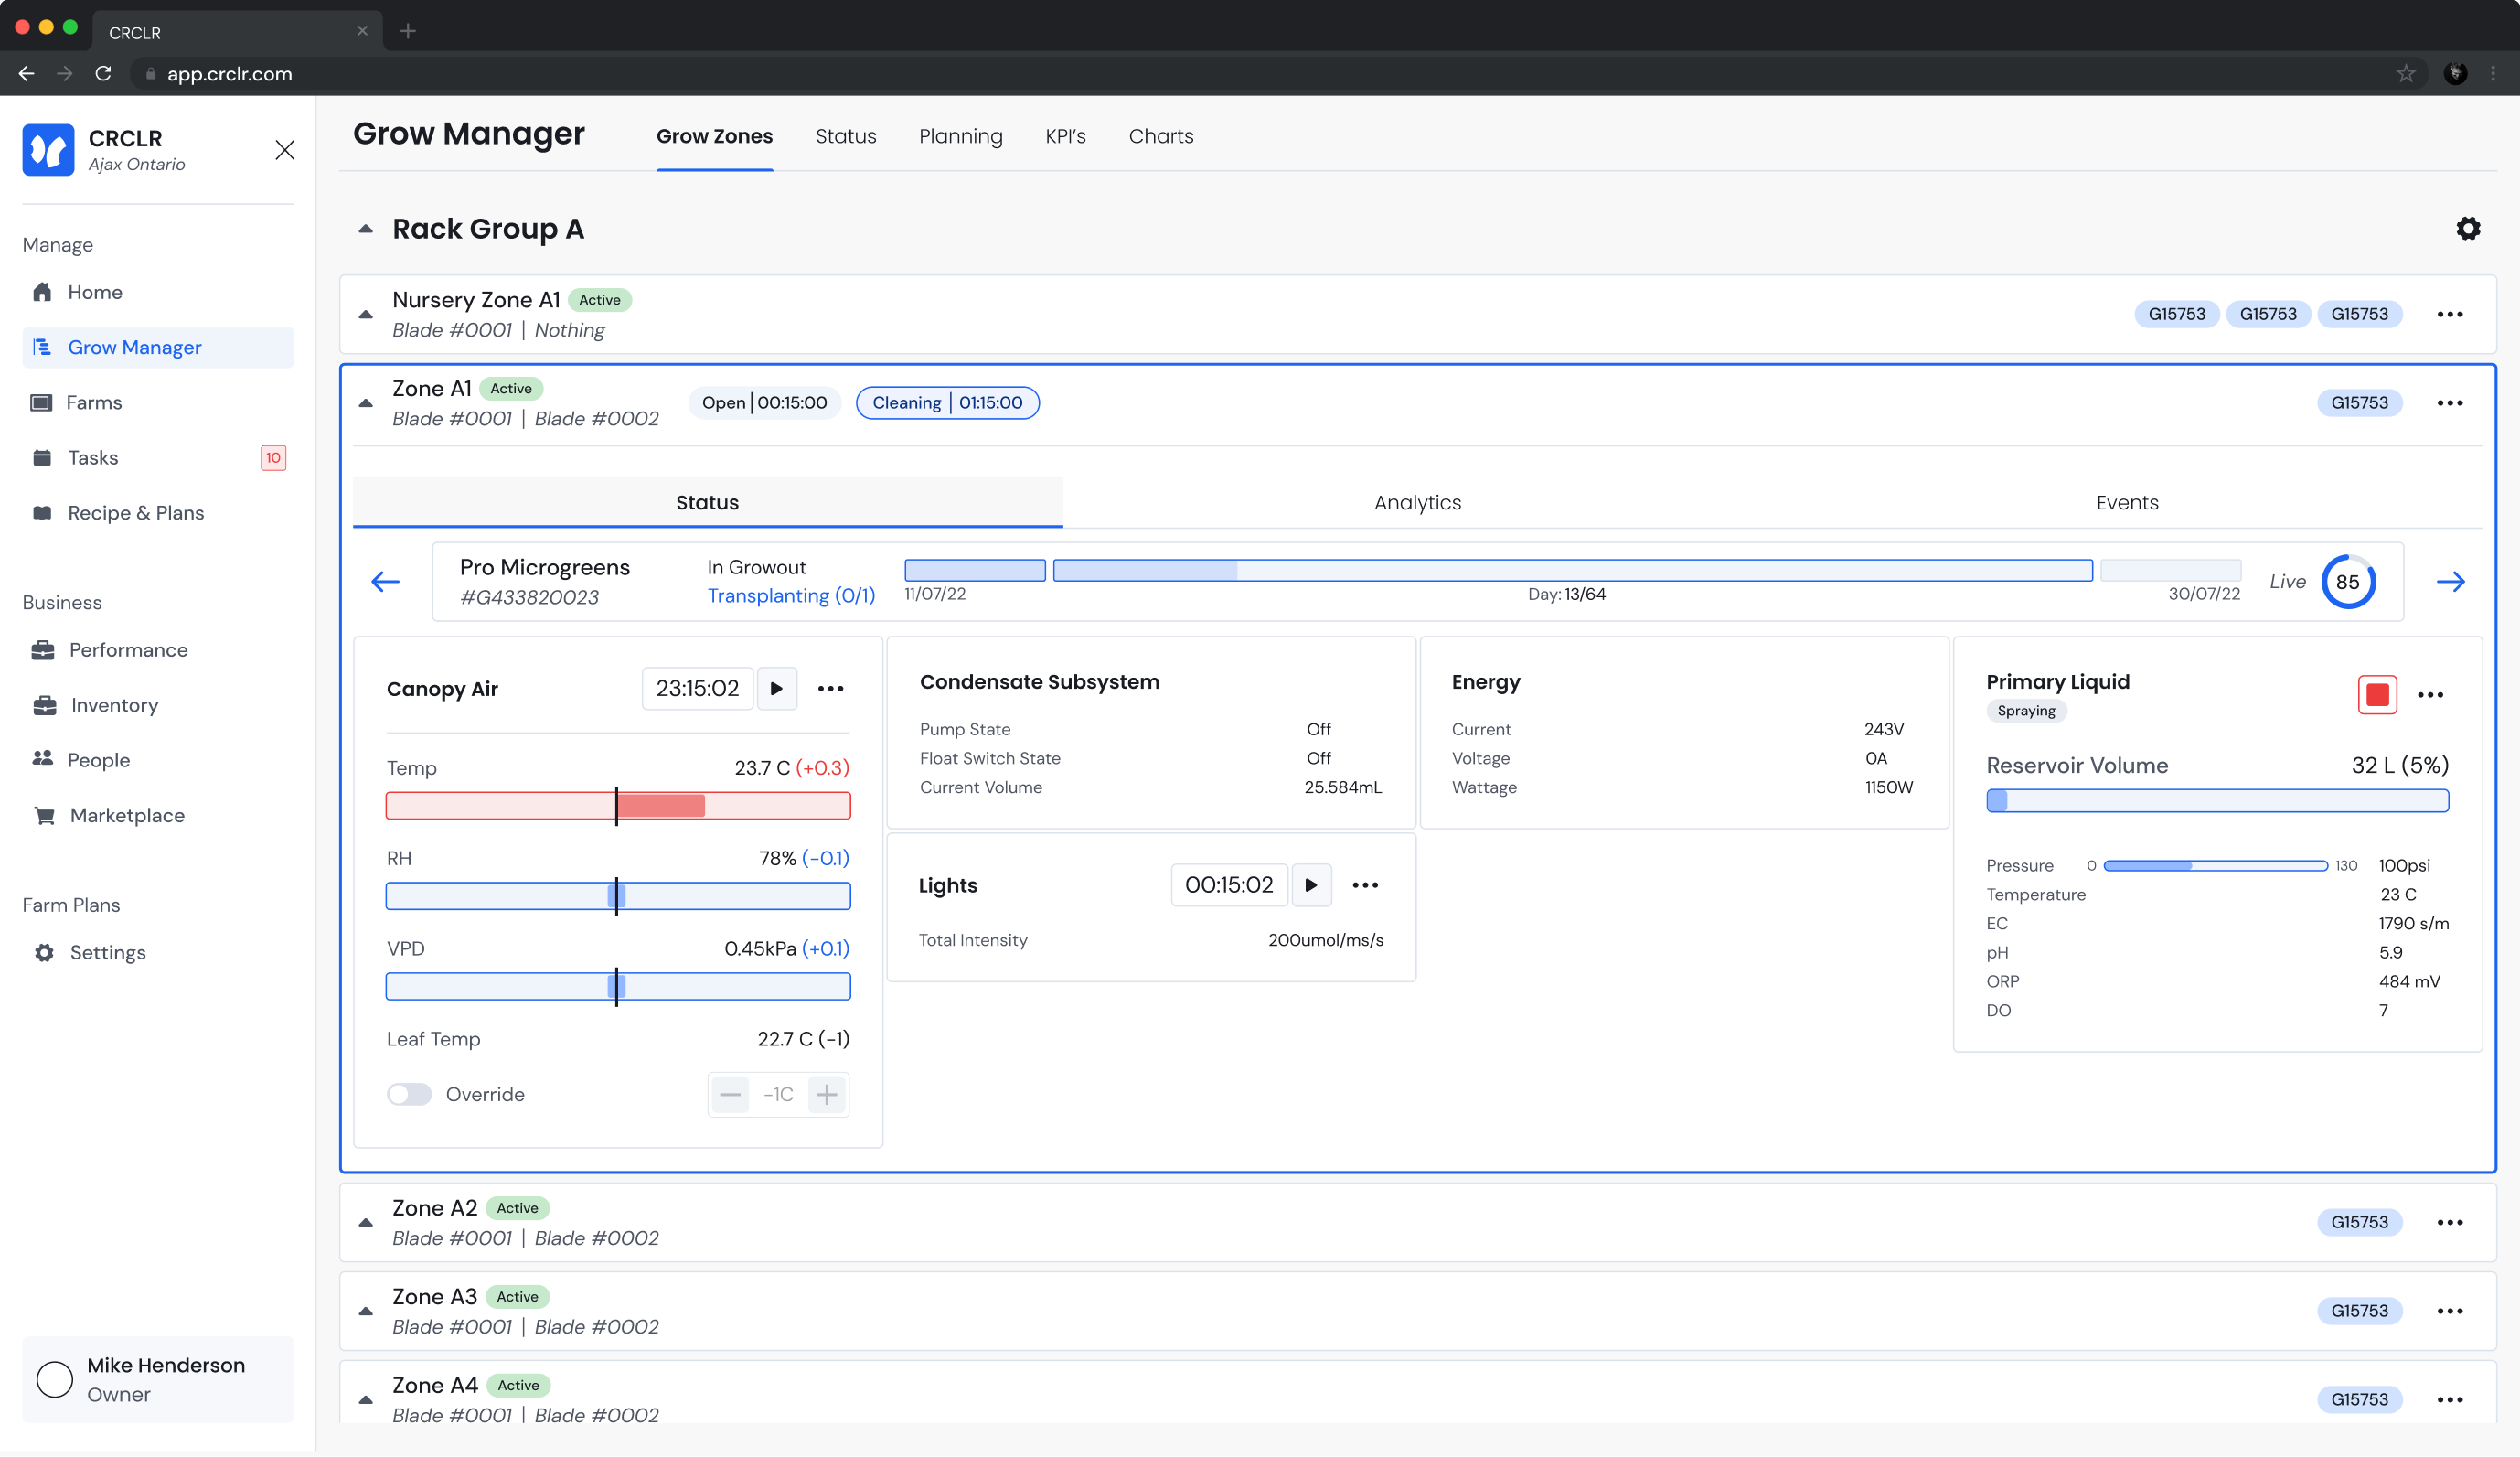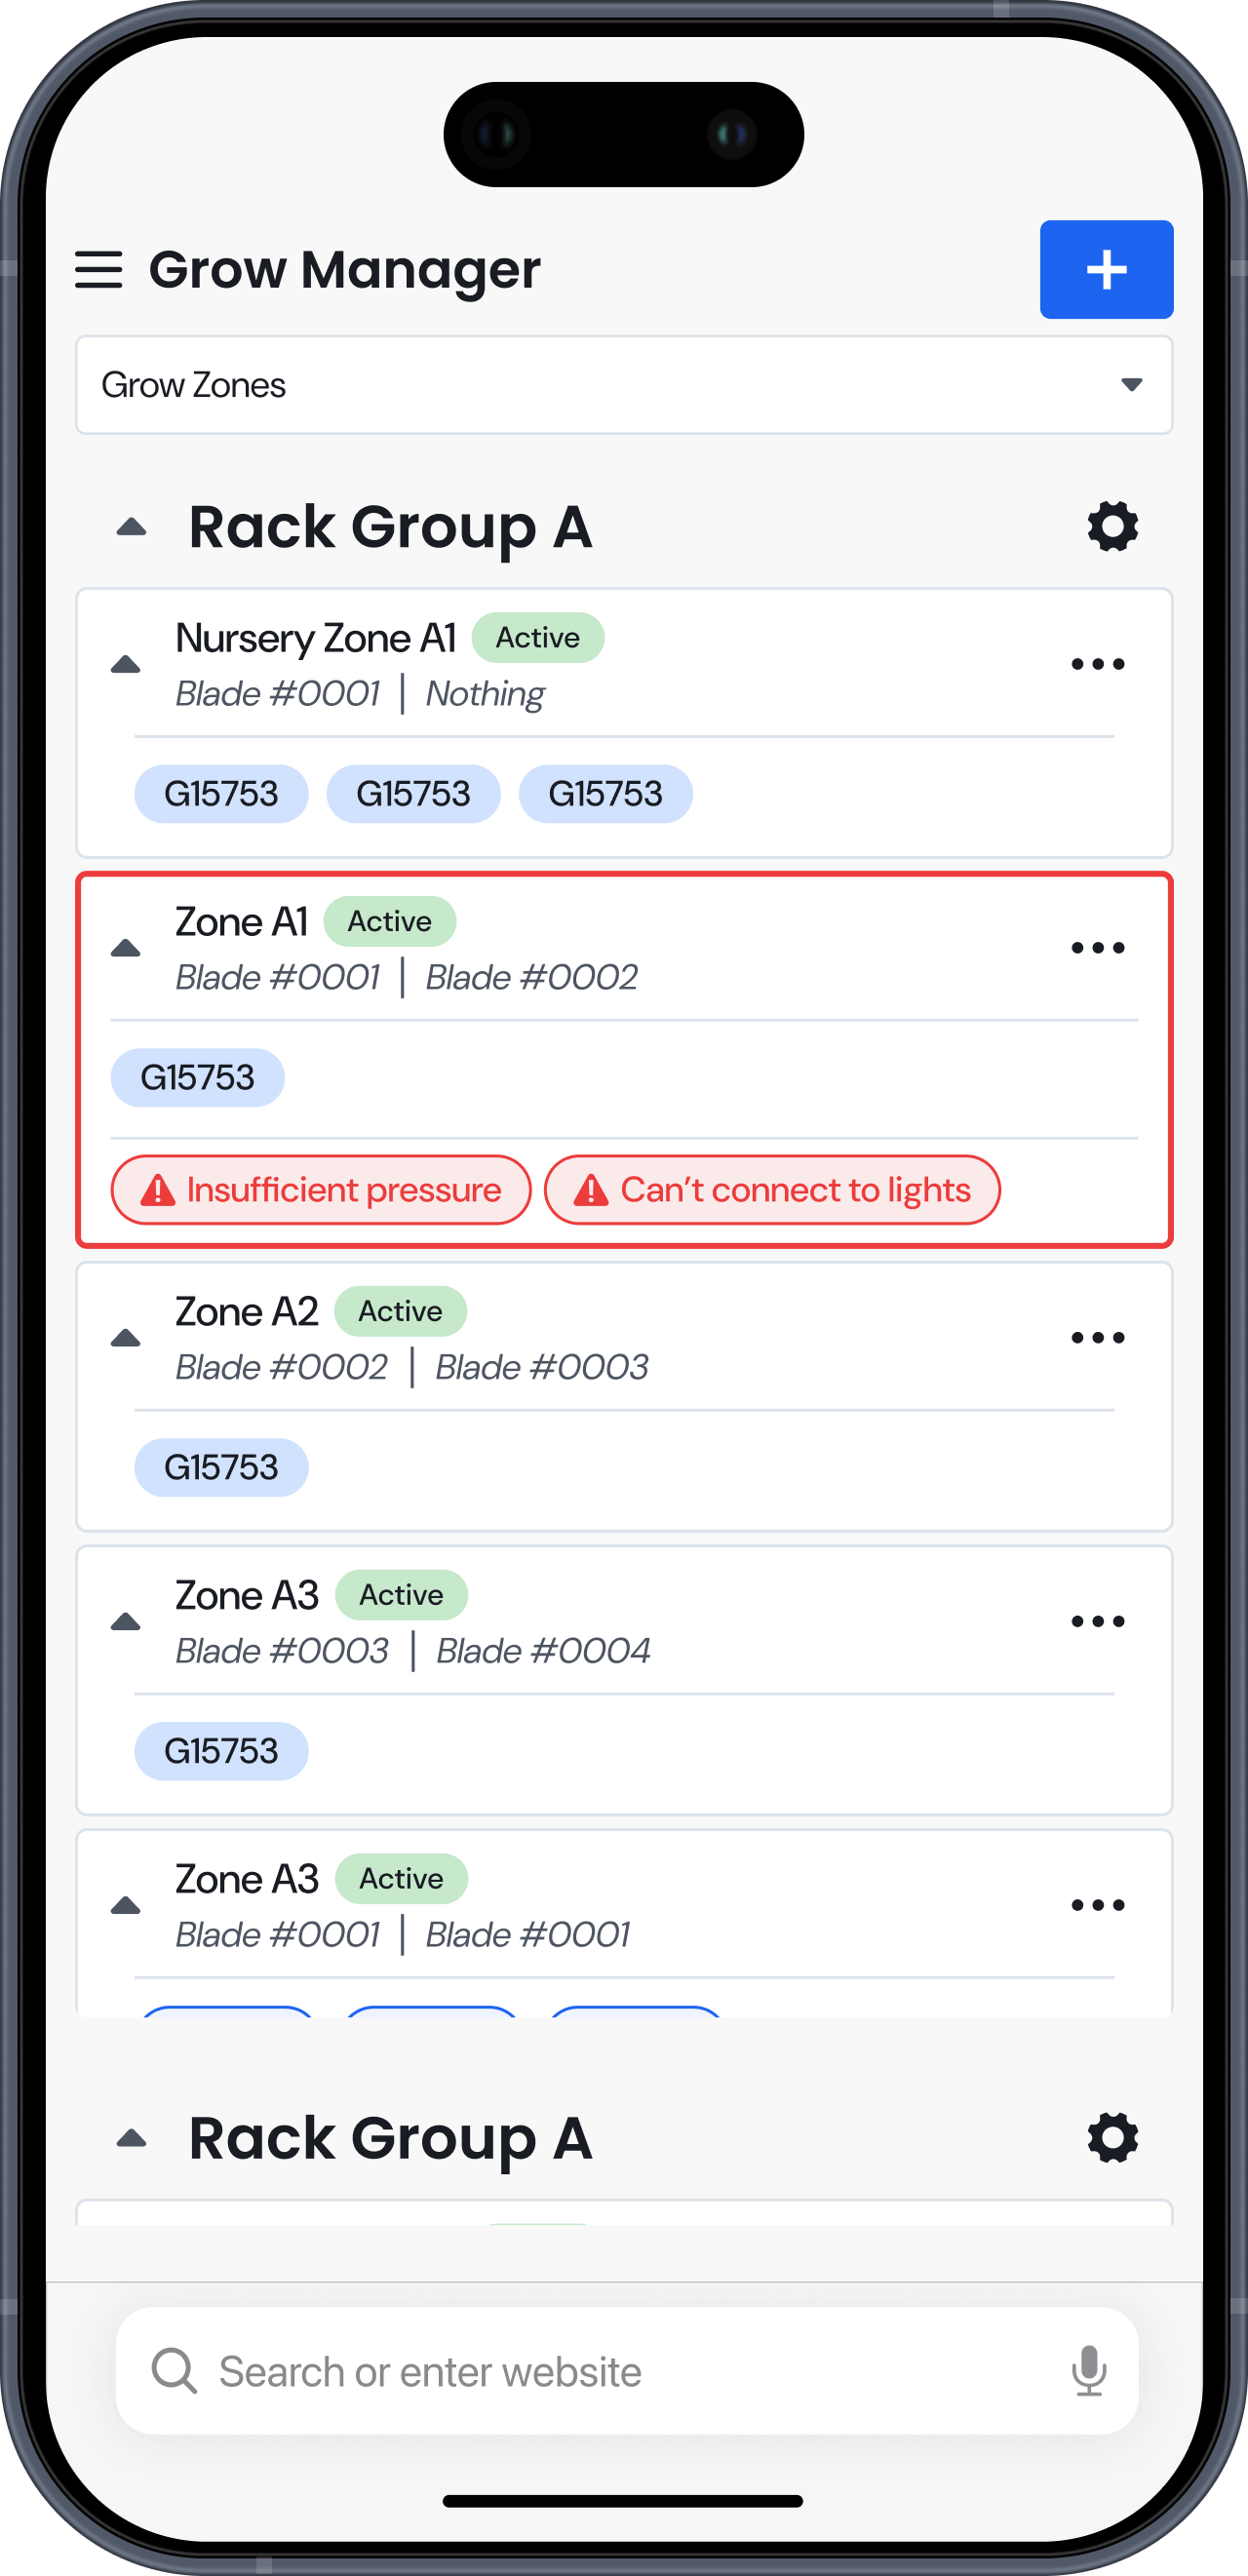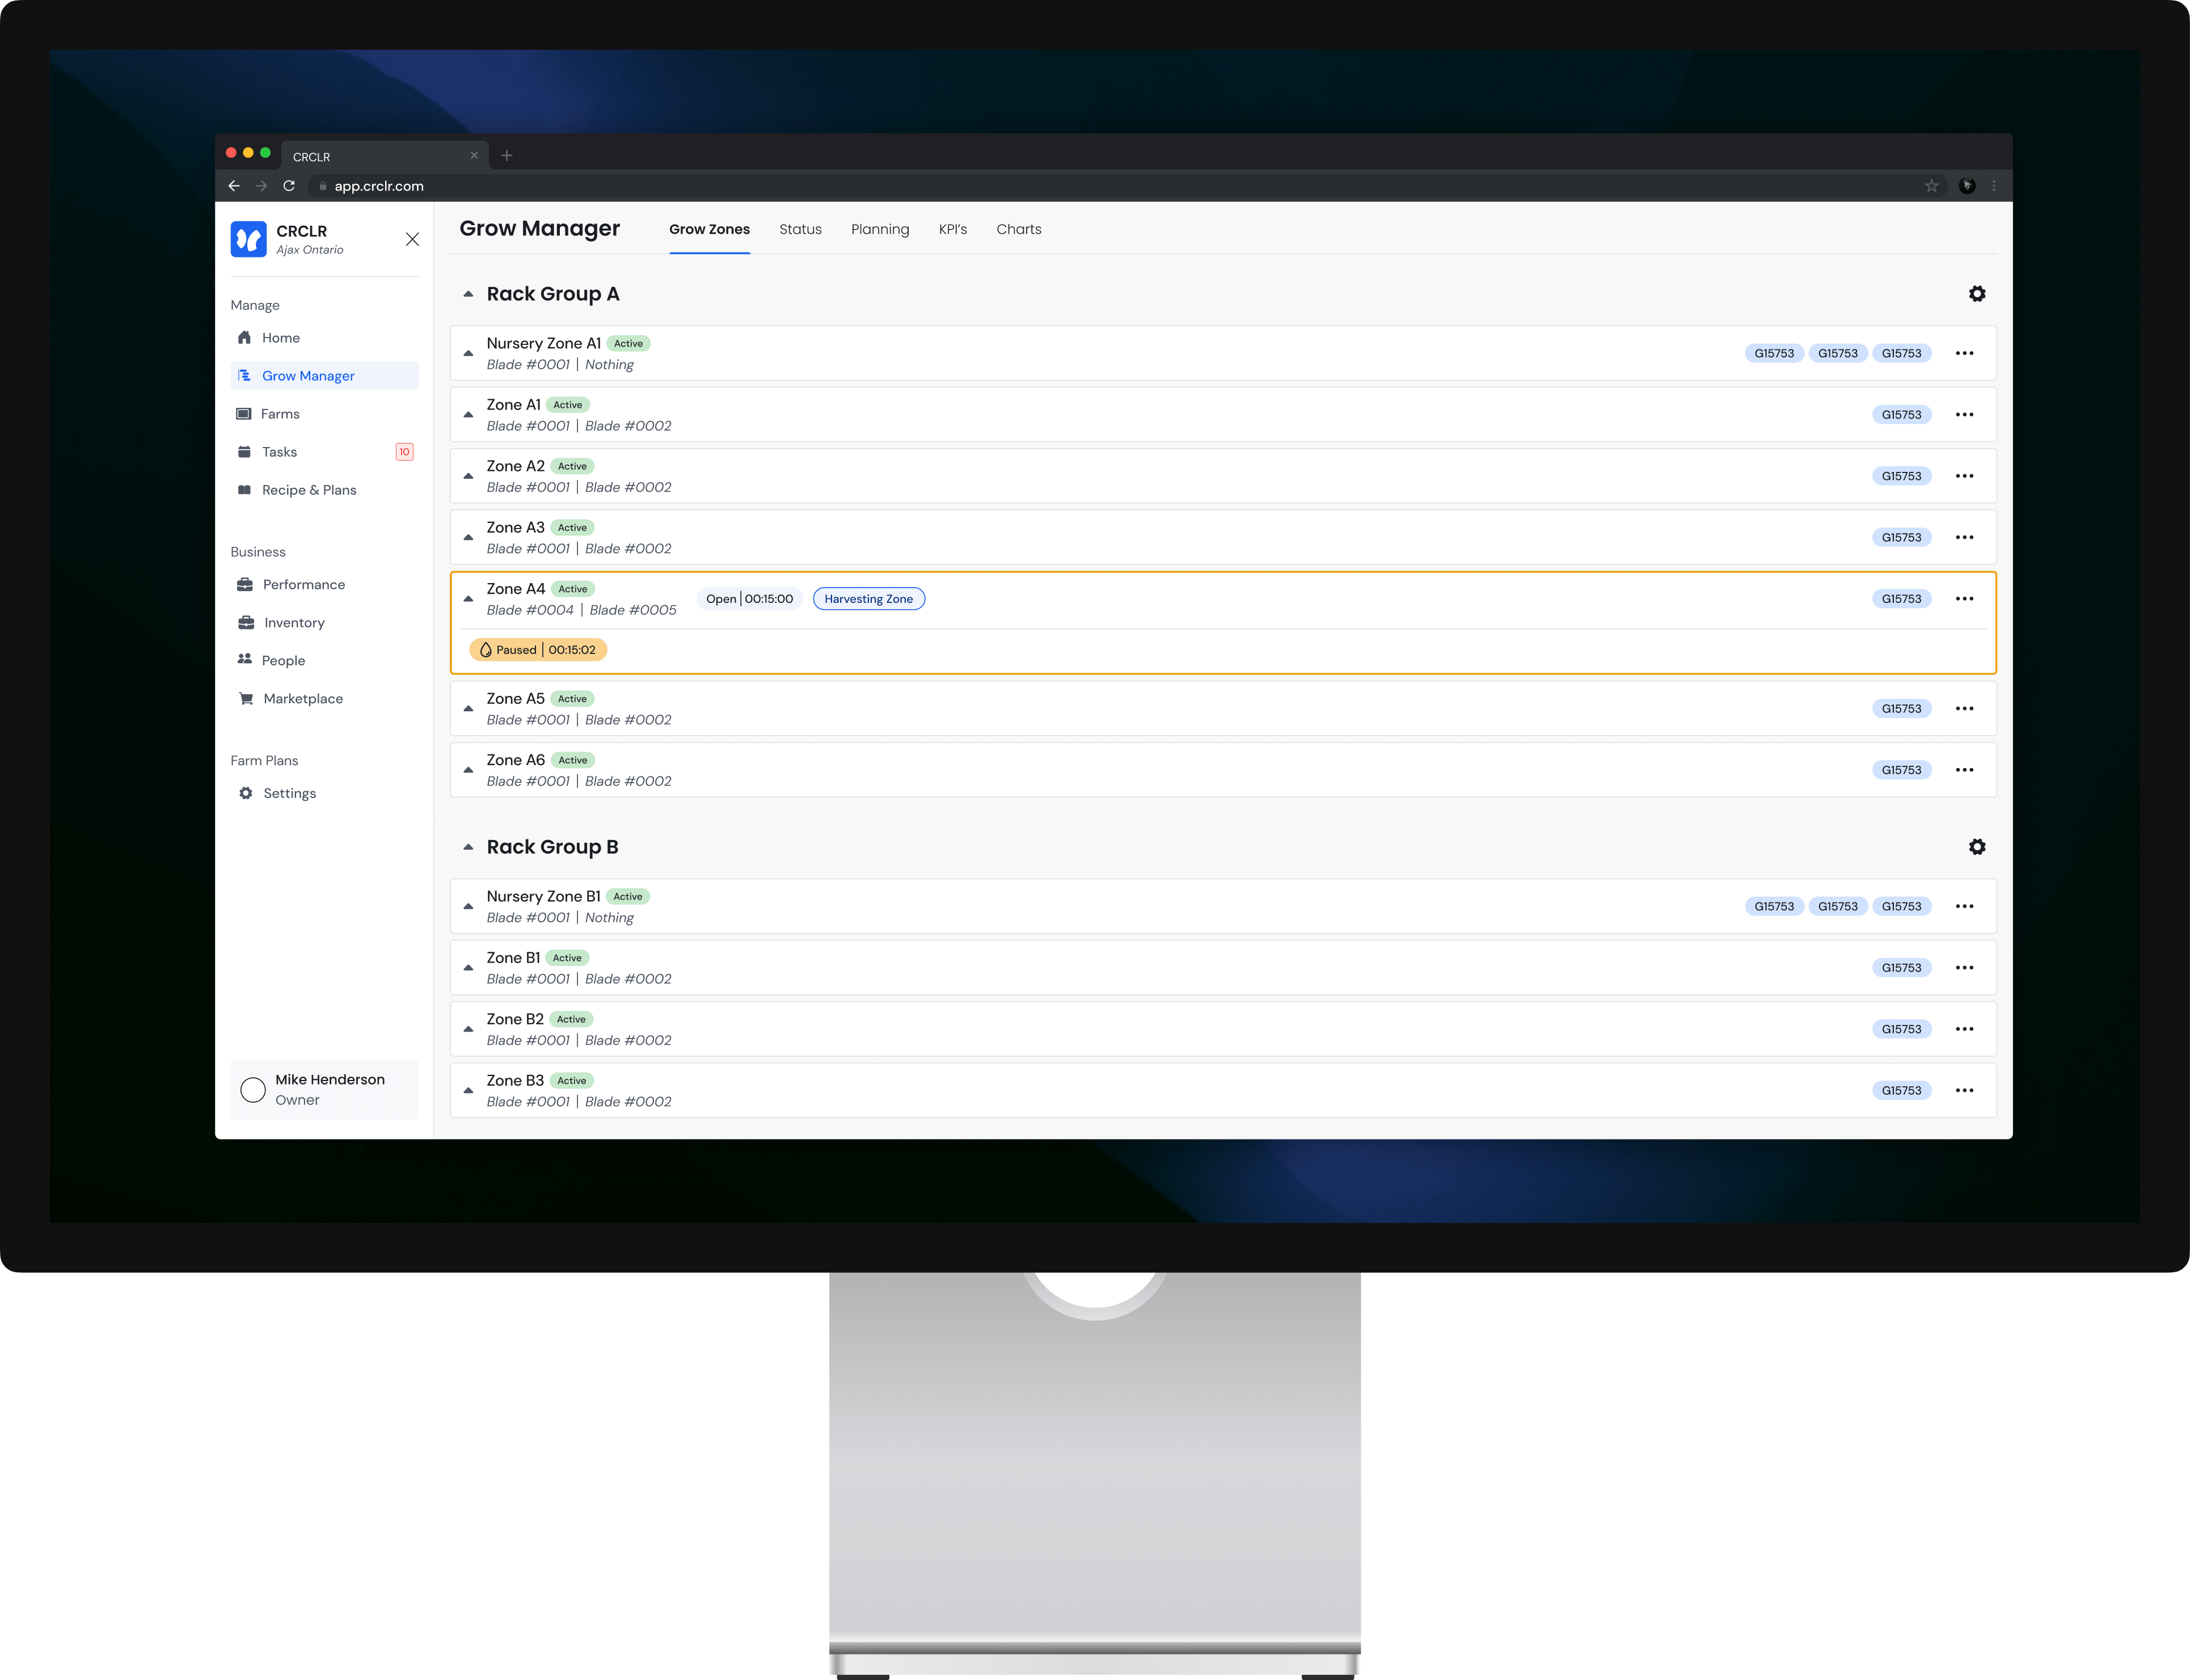
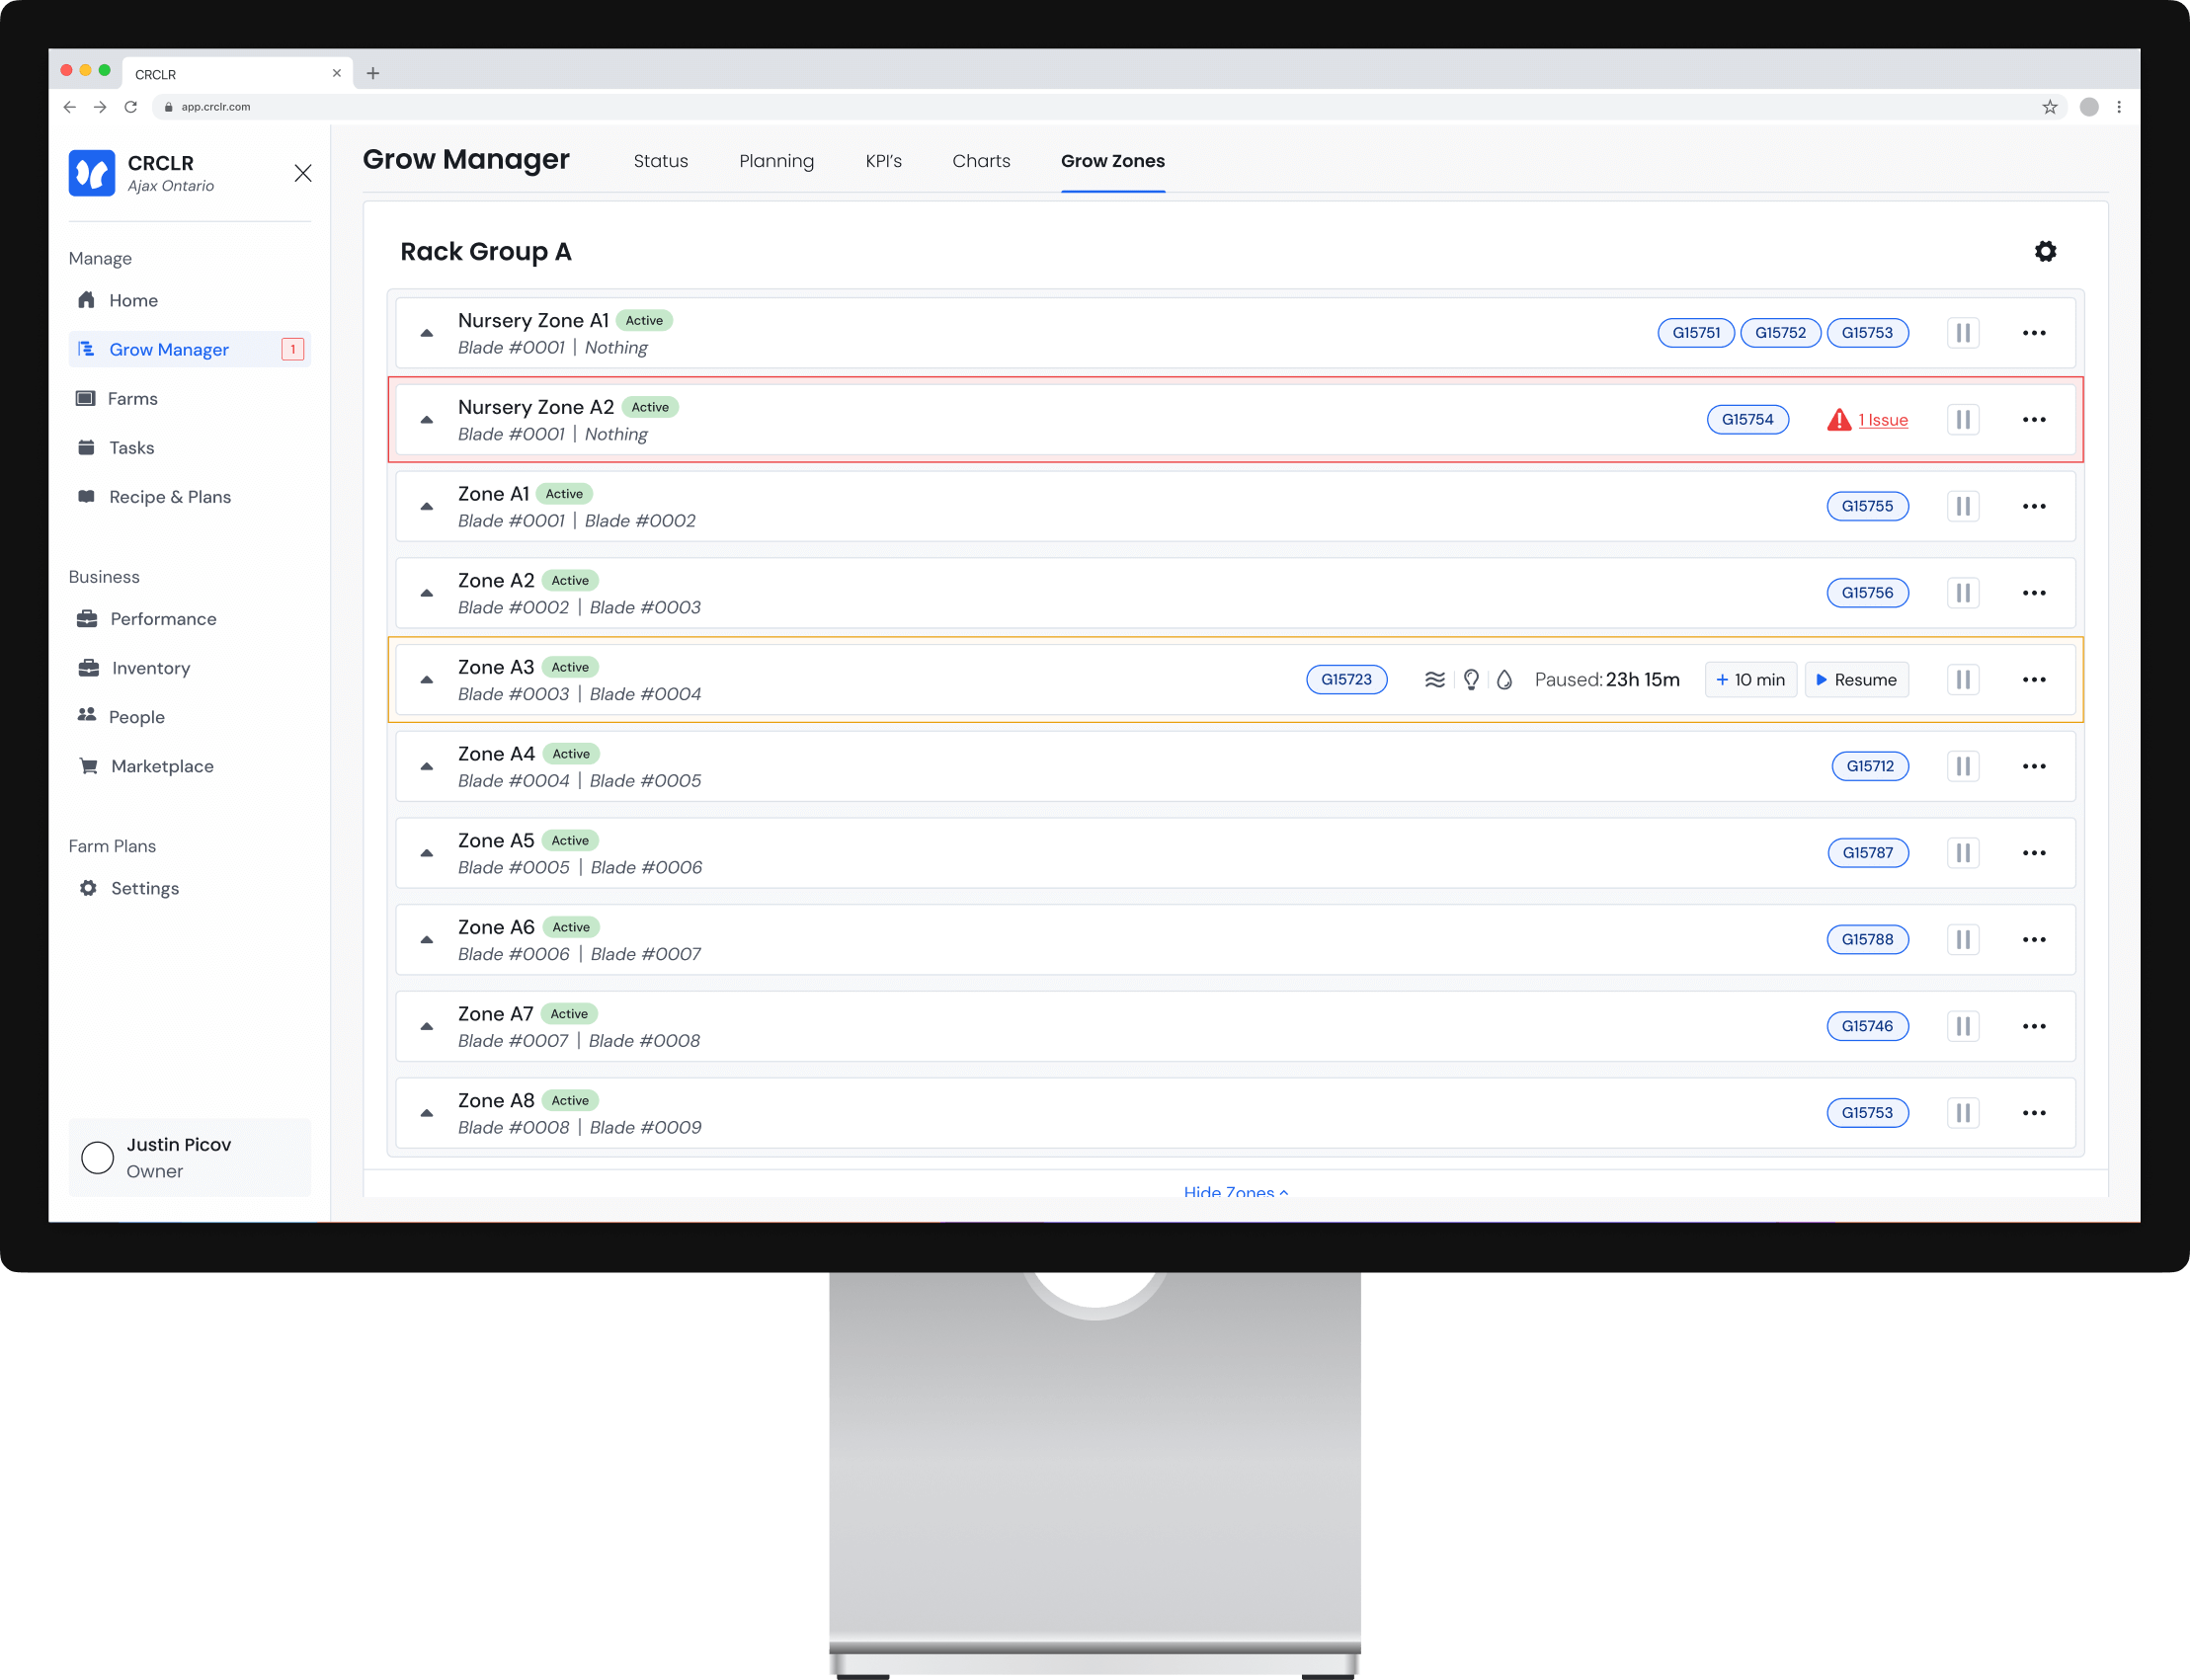
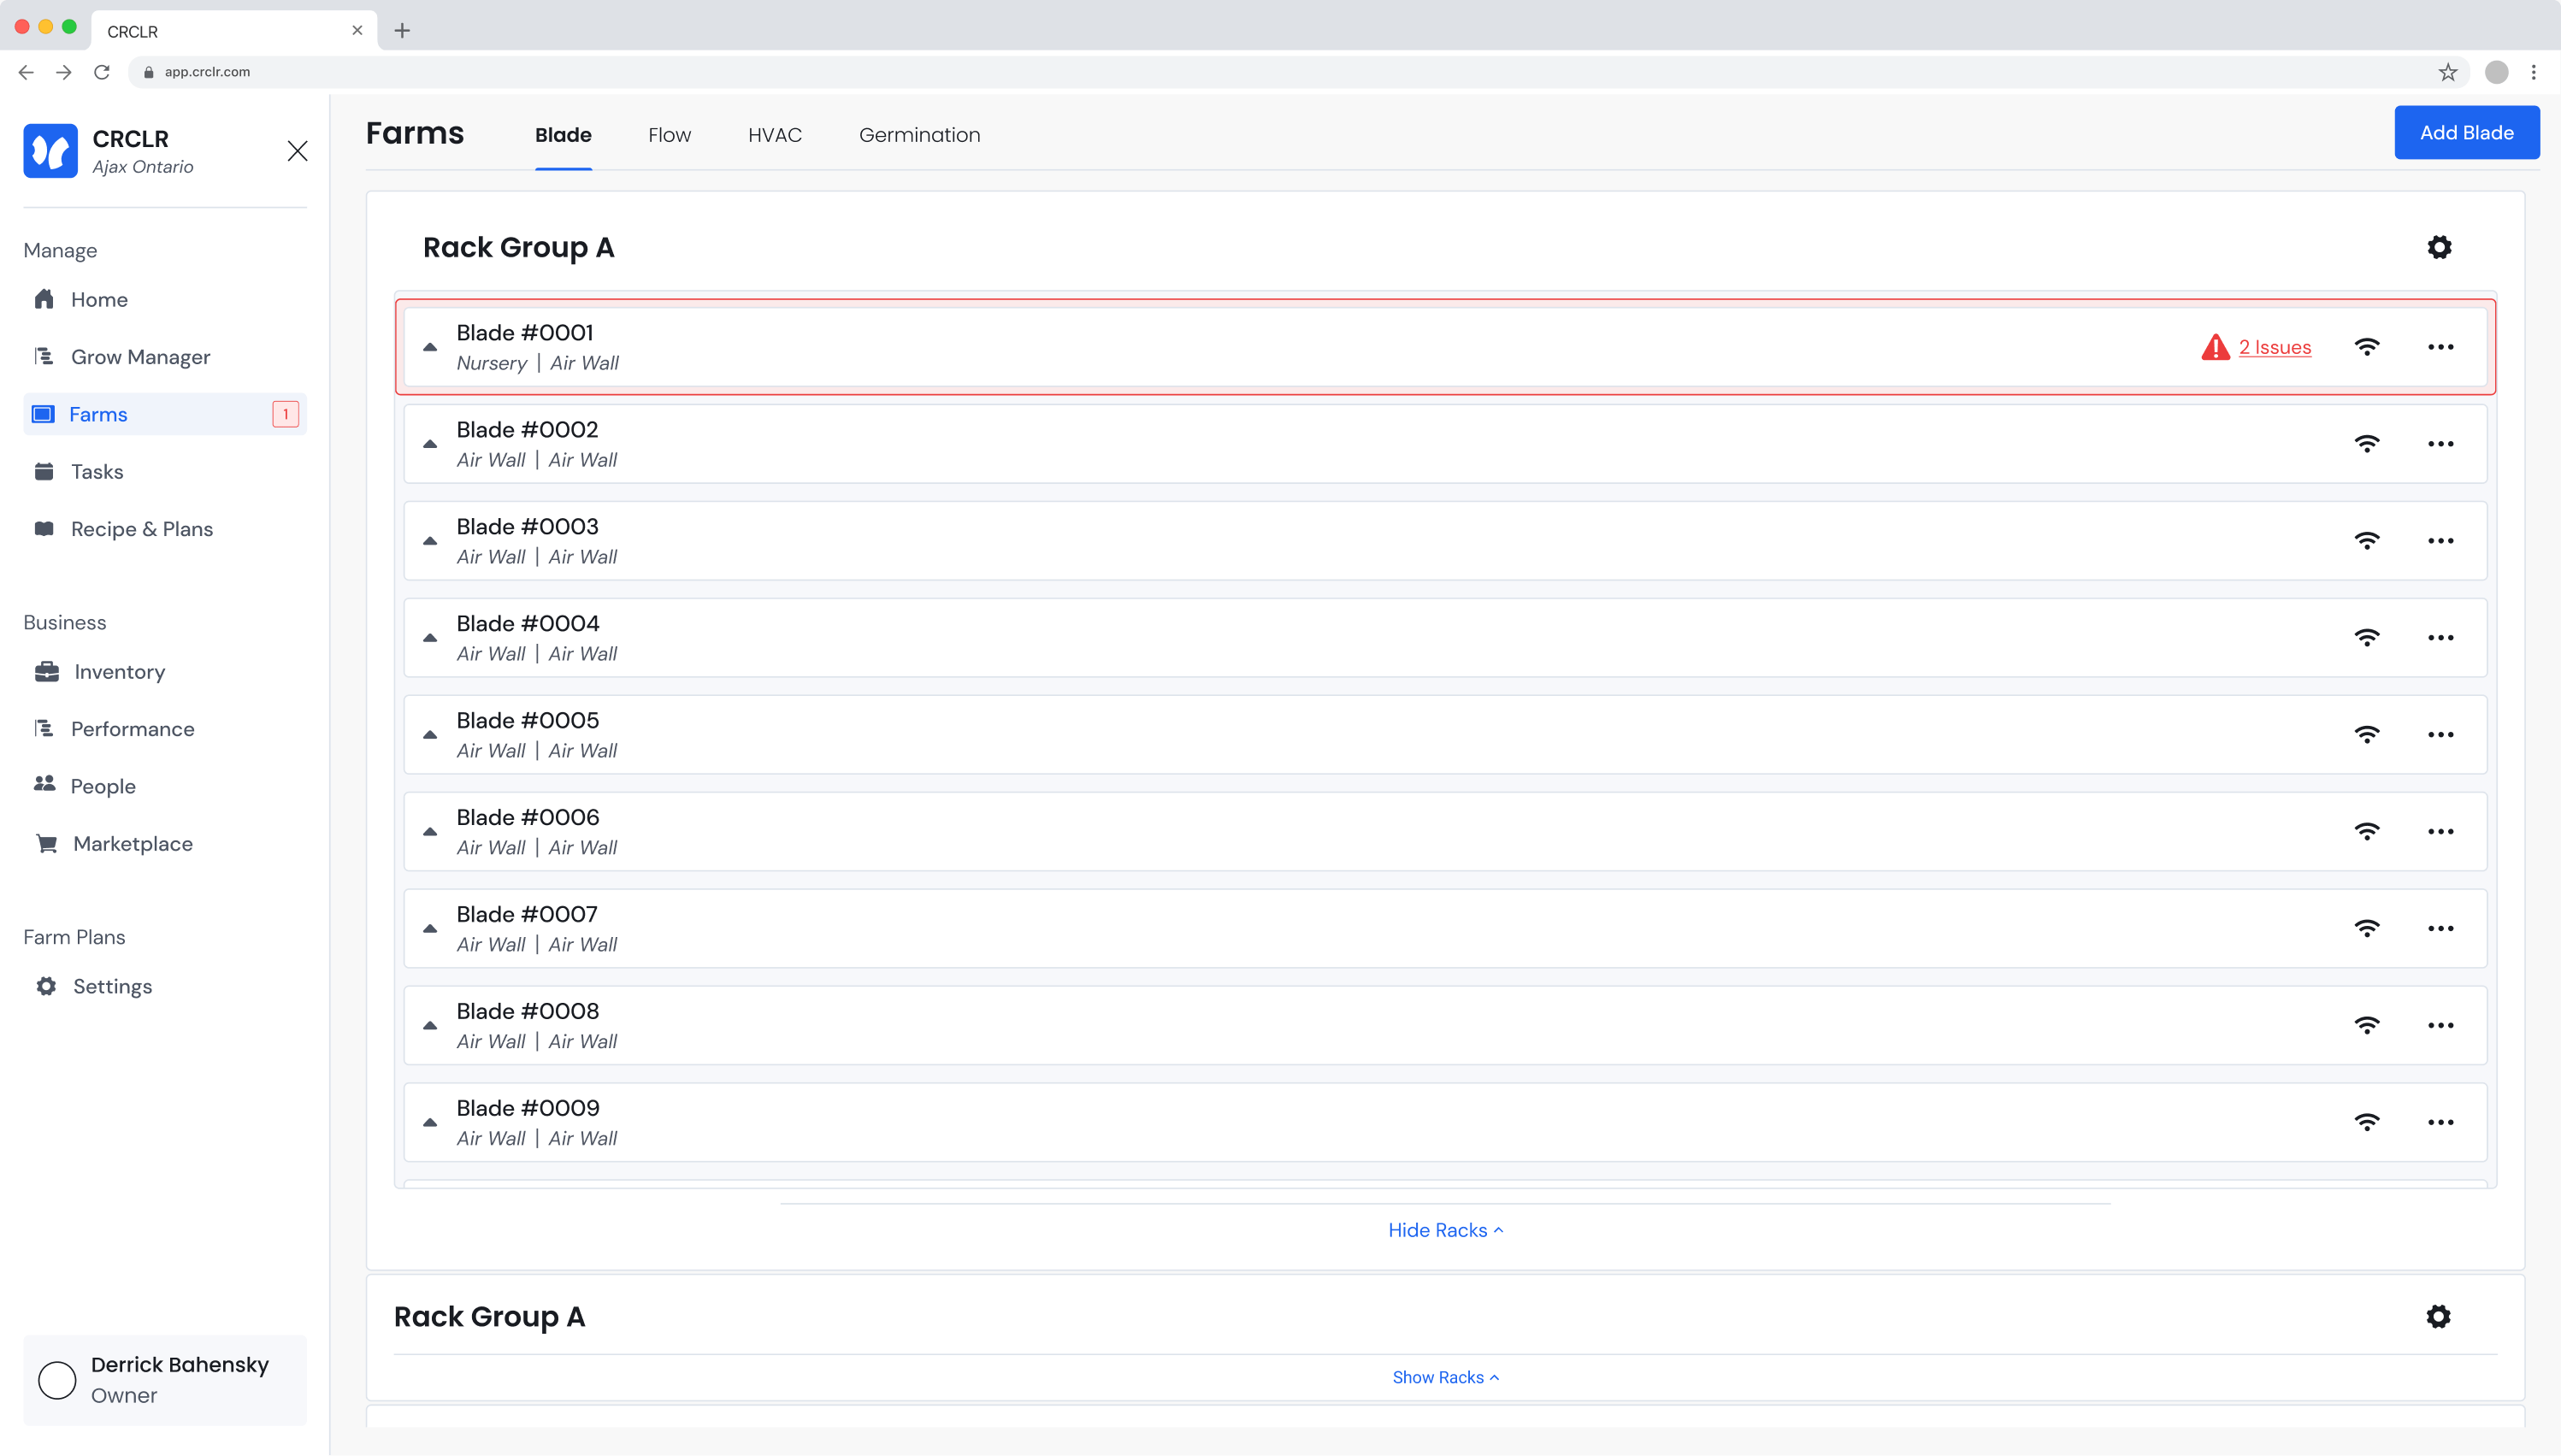
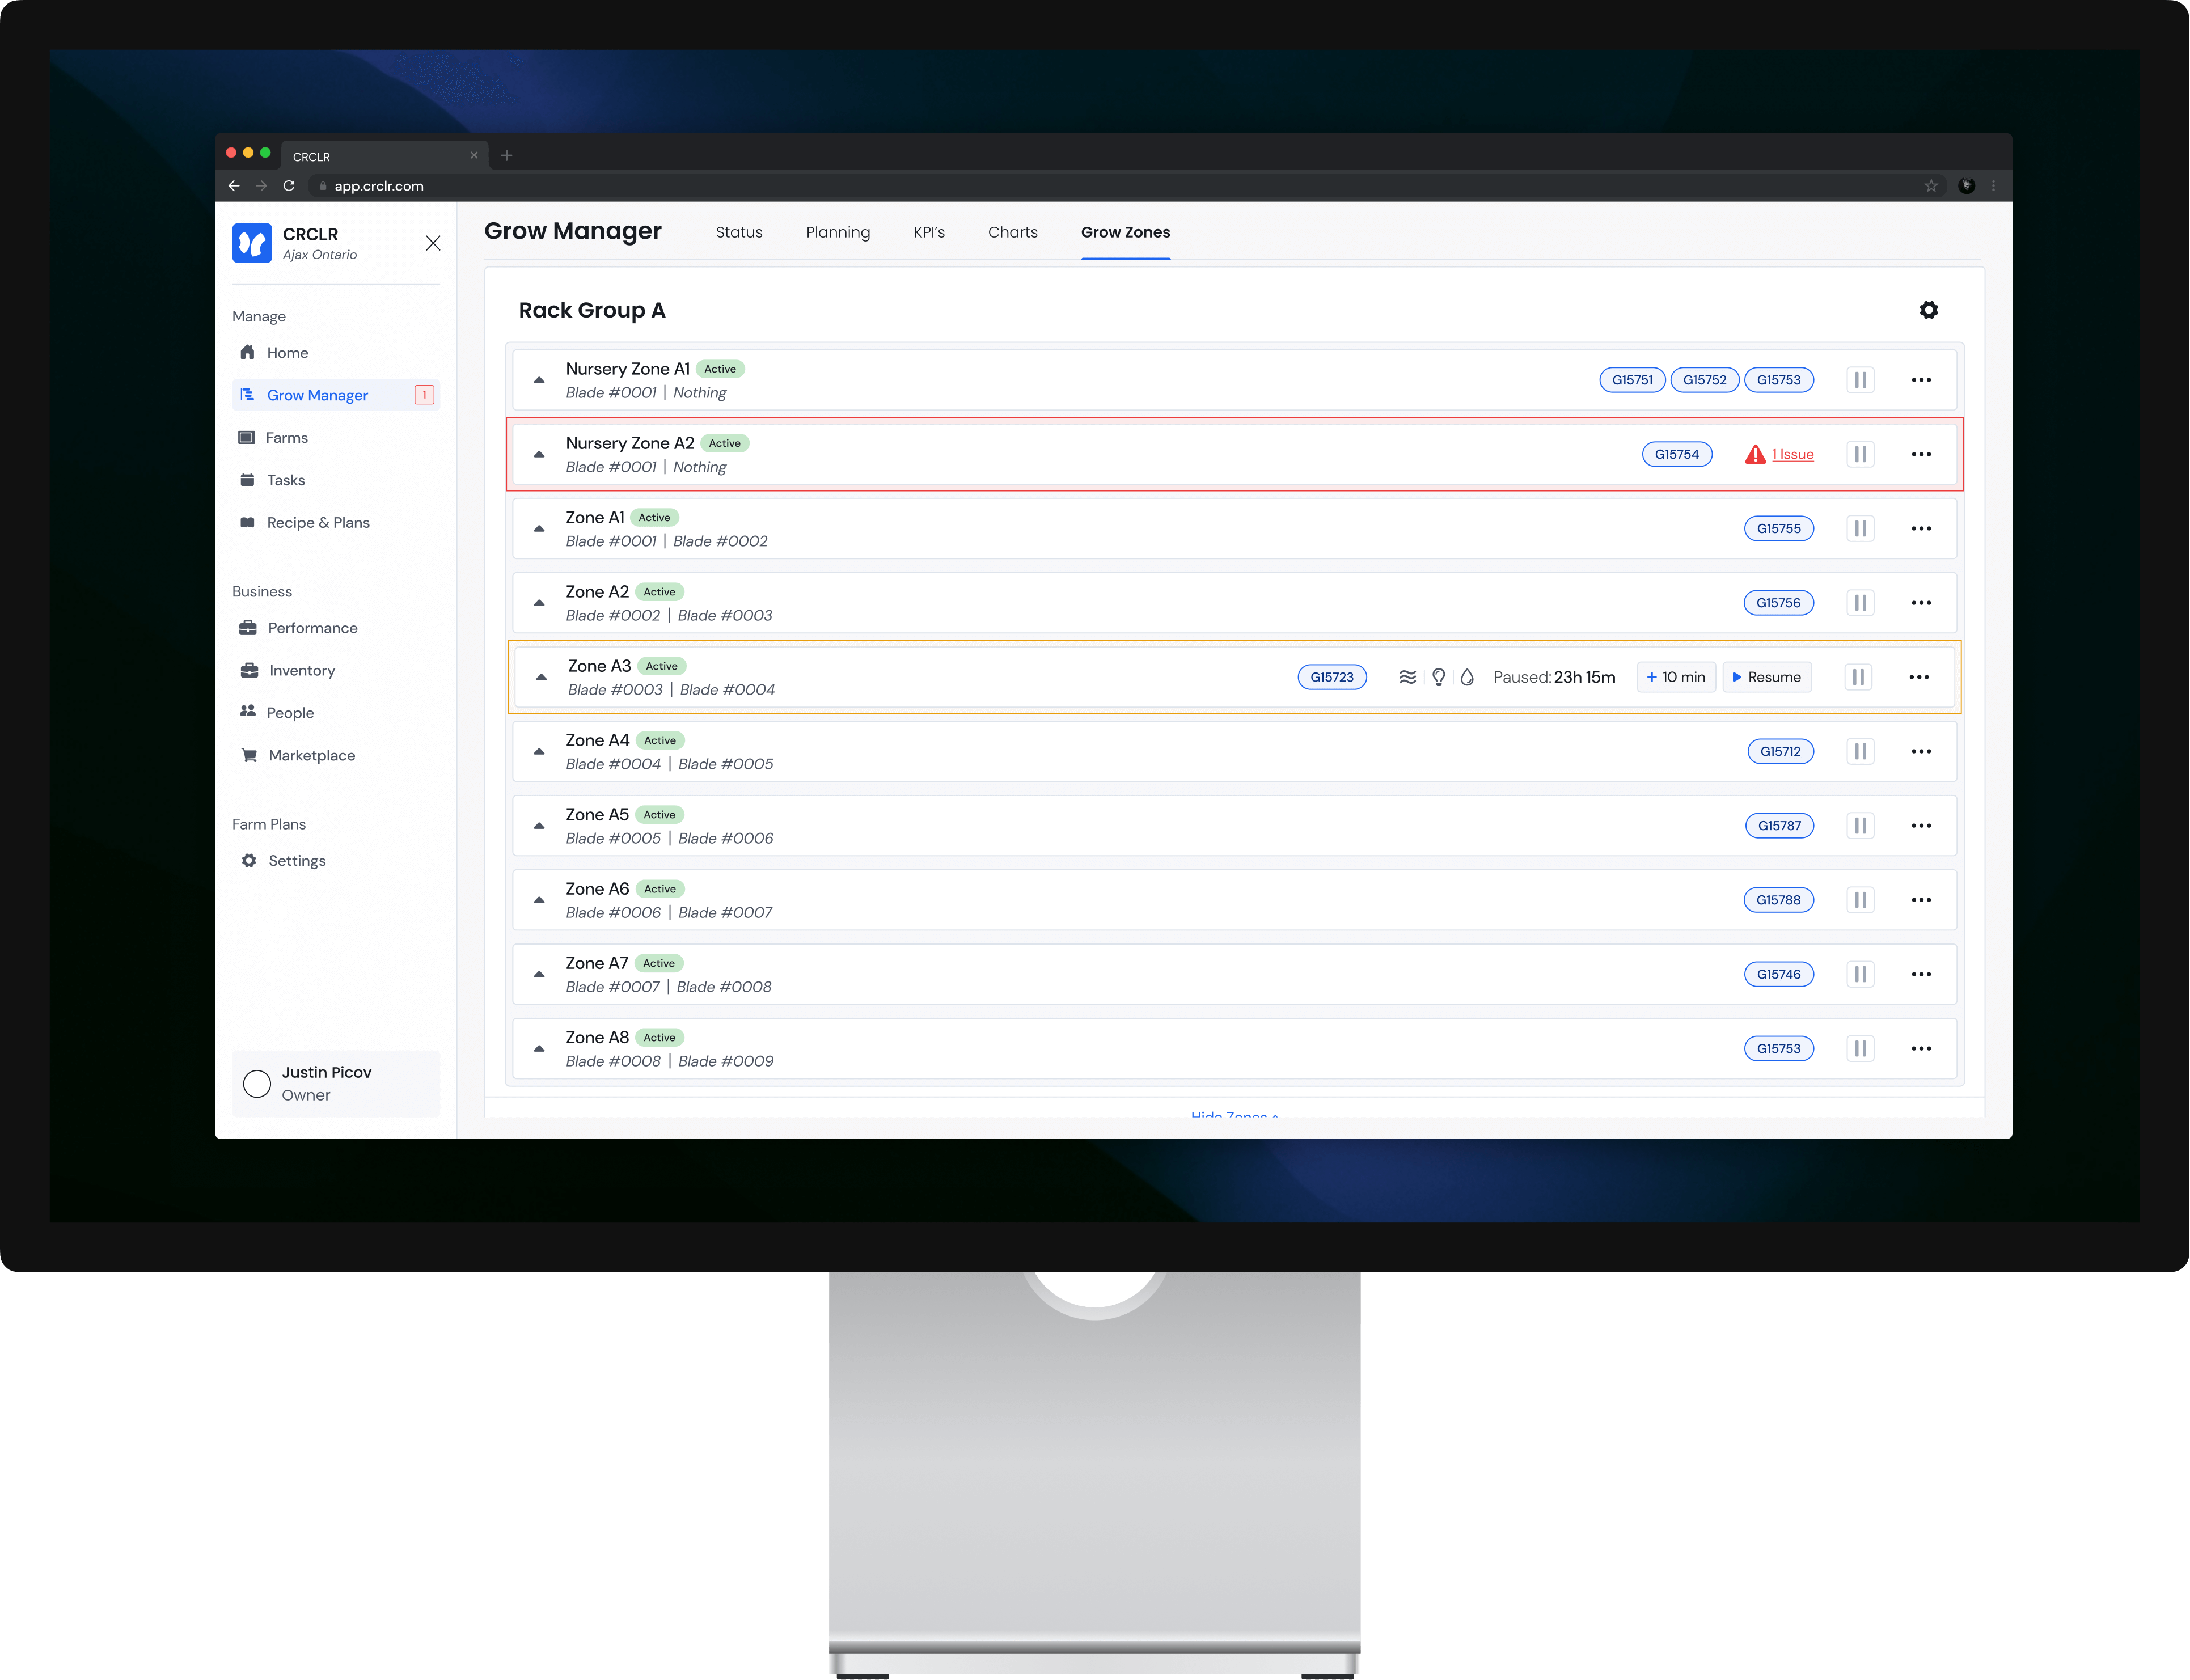
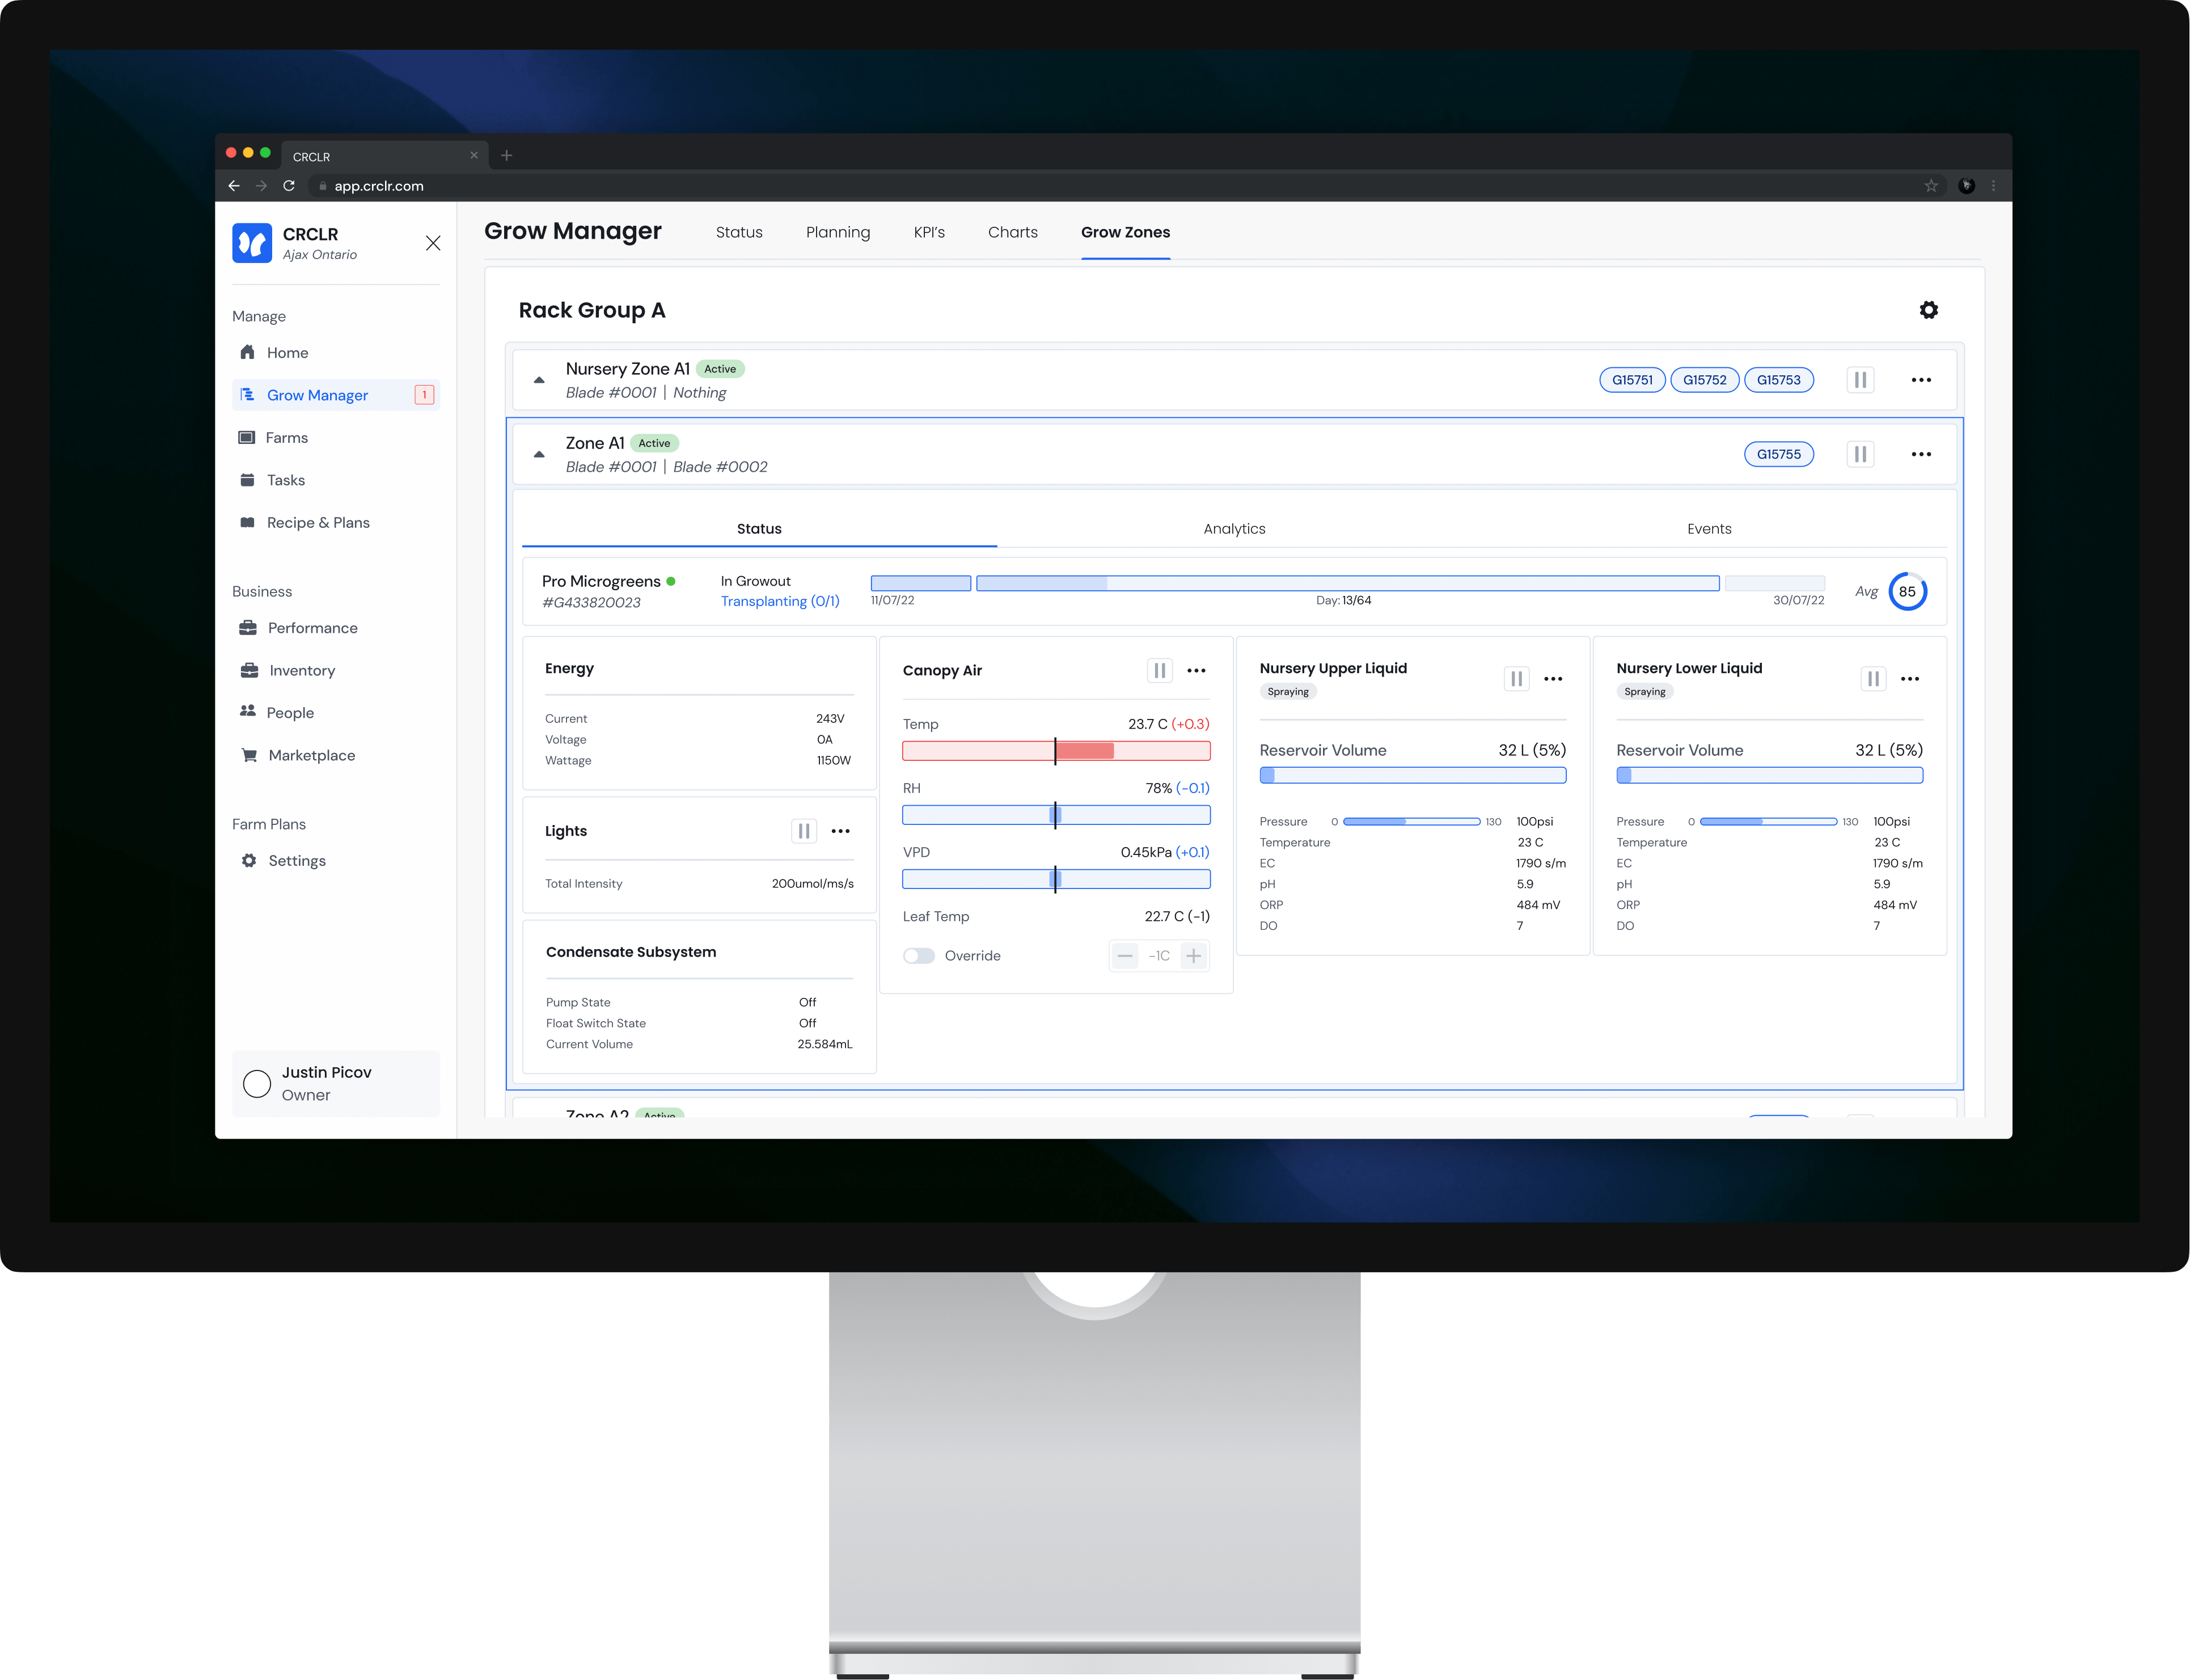
The zone management page give users key info as to their farms activity at a glance. Both colours & text inform the users of zone activity, issues, active grows & more.
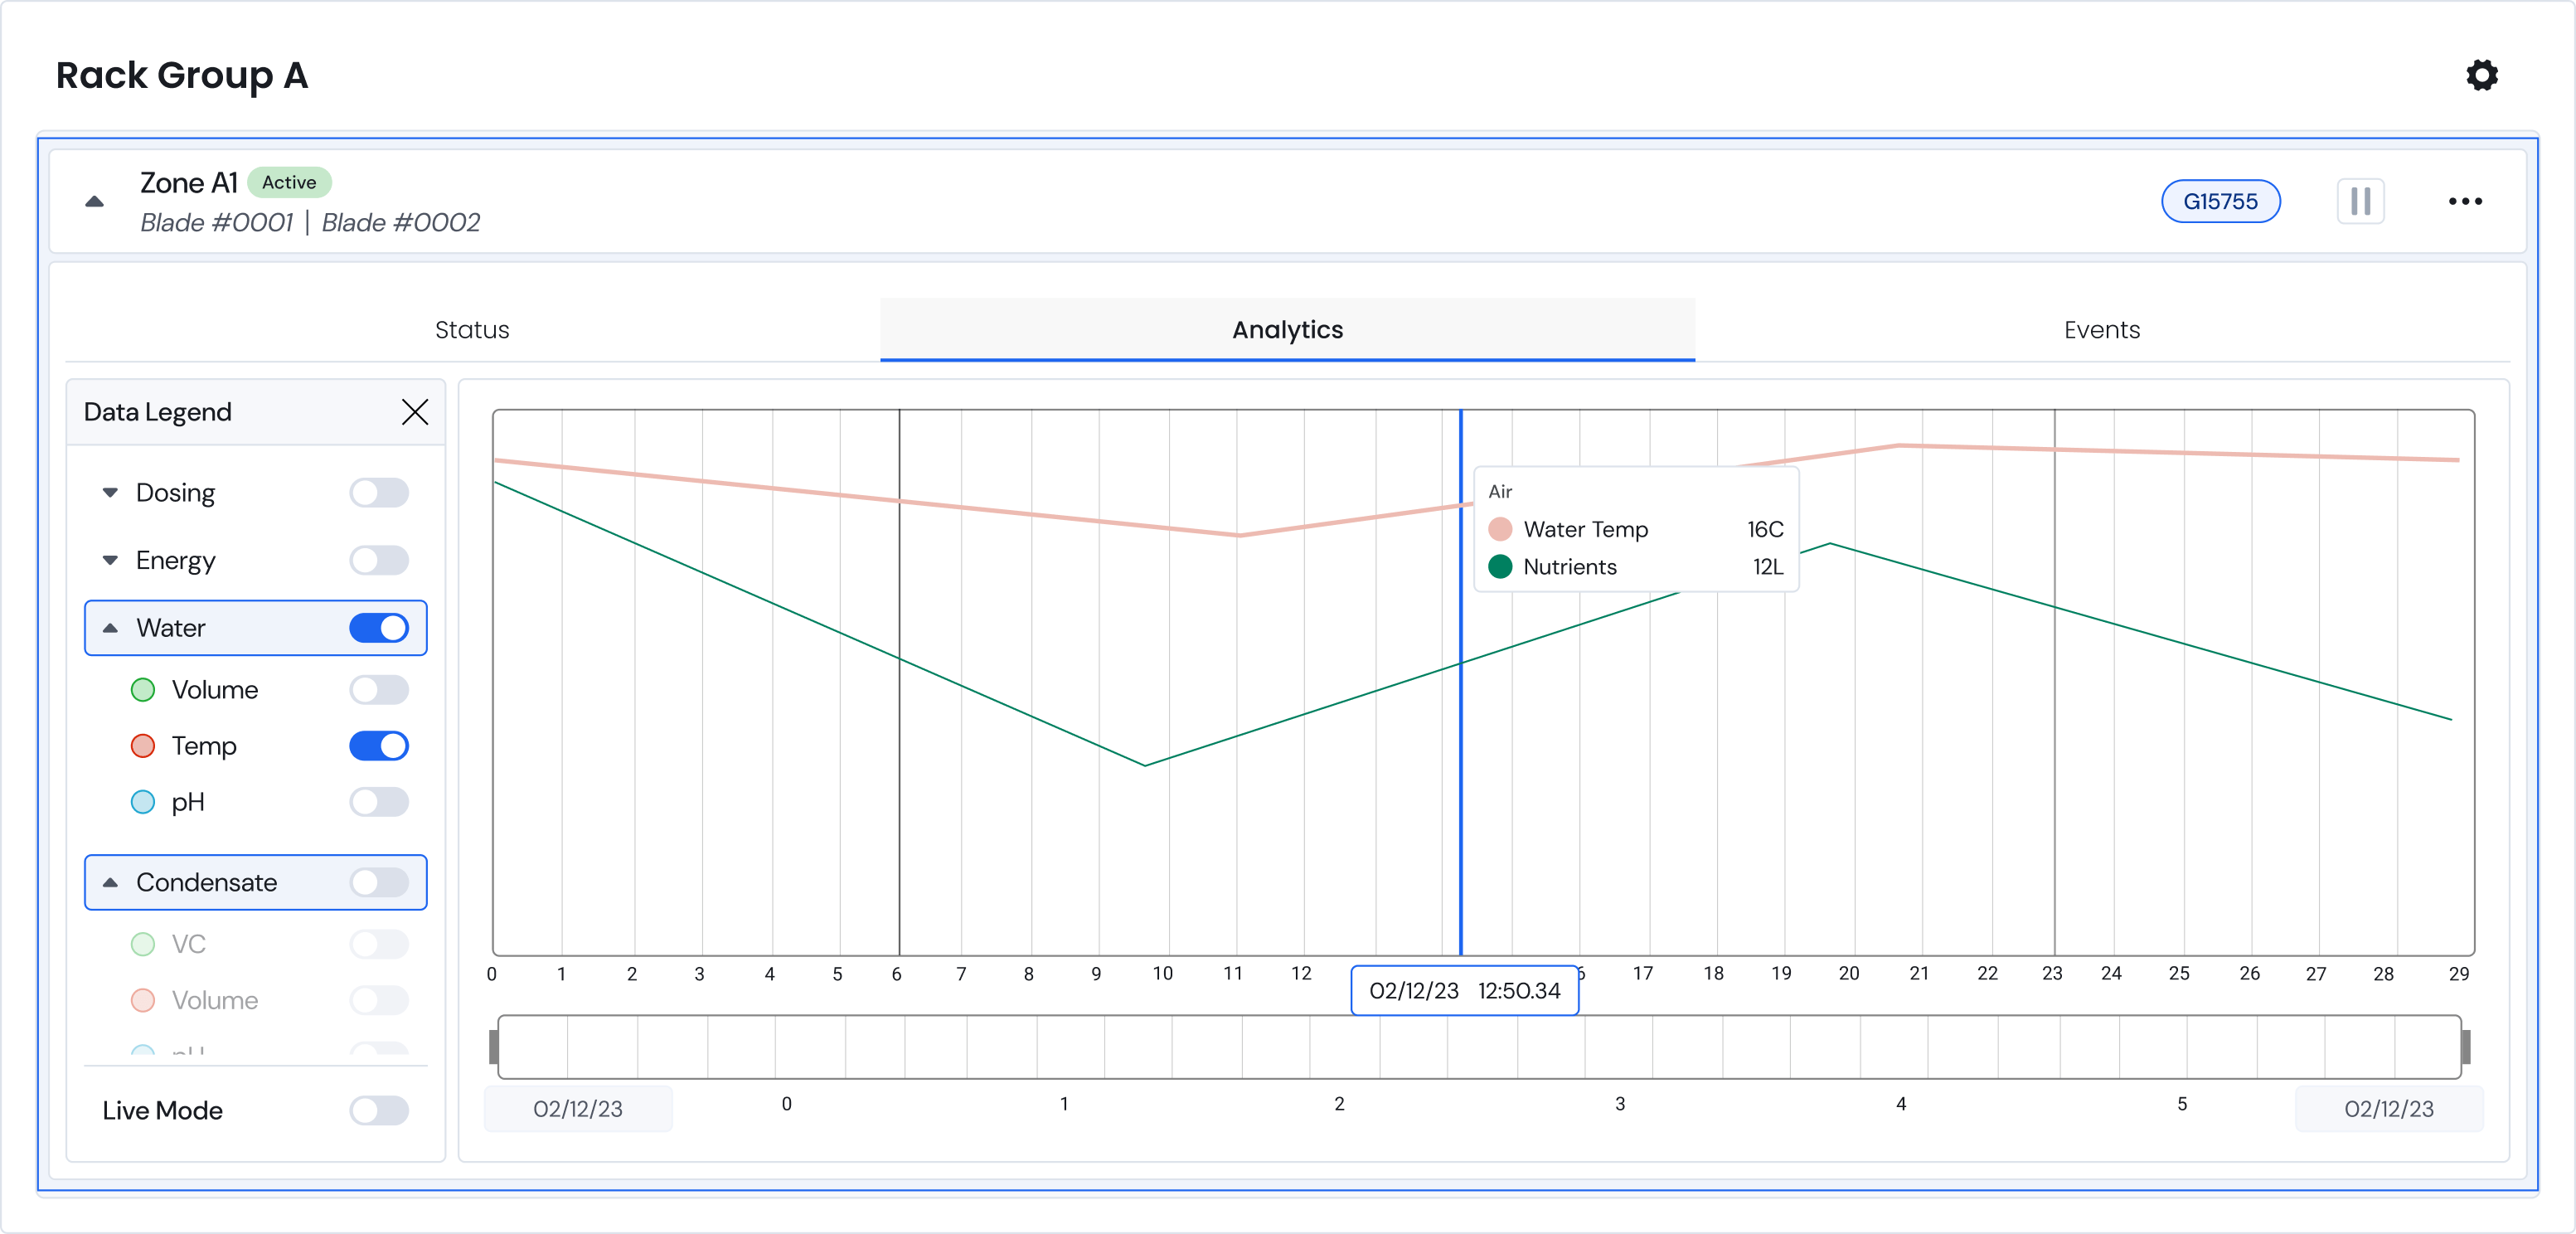
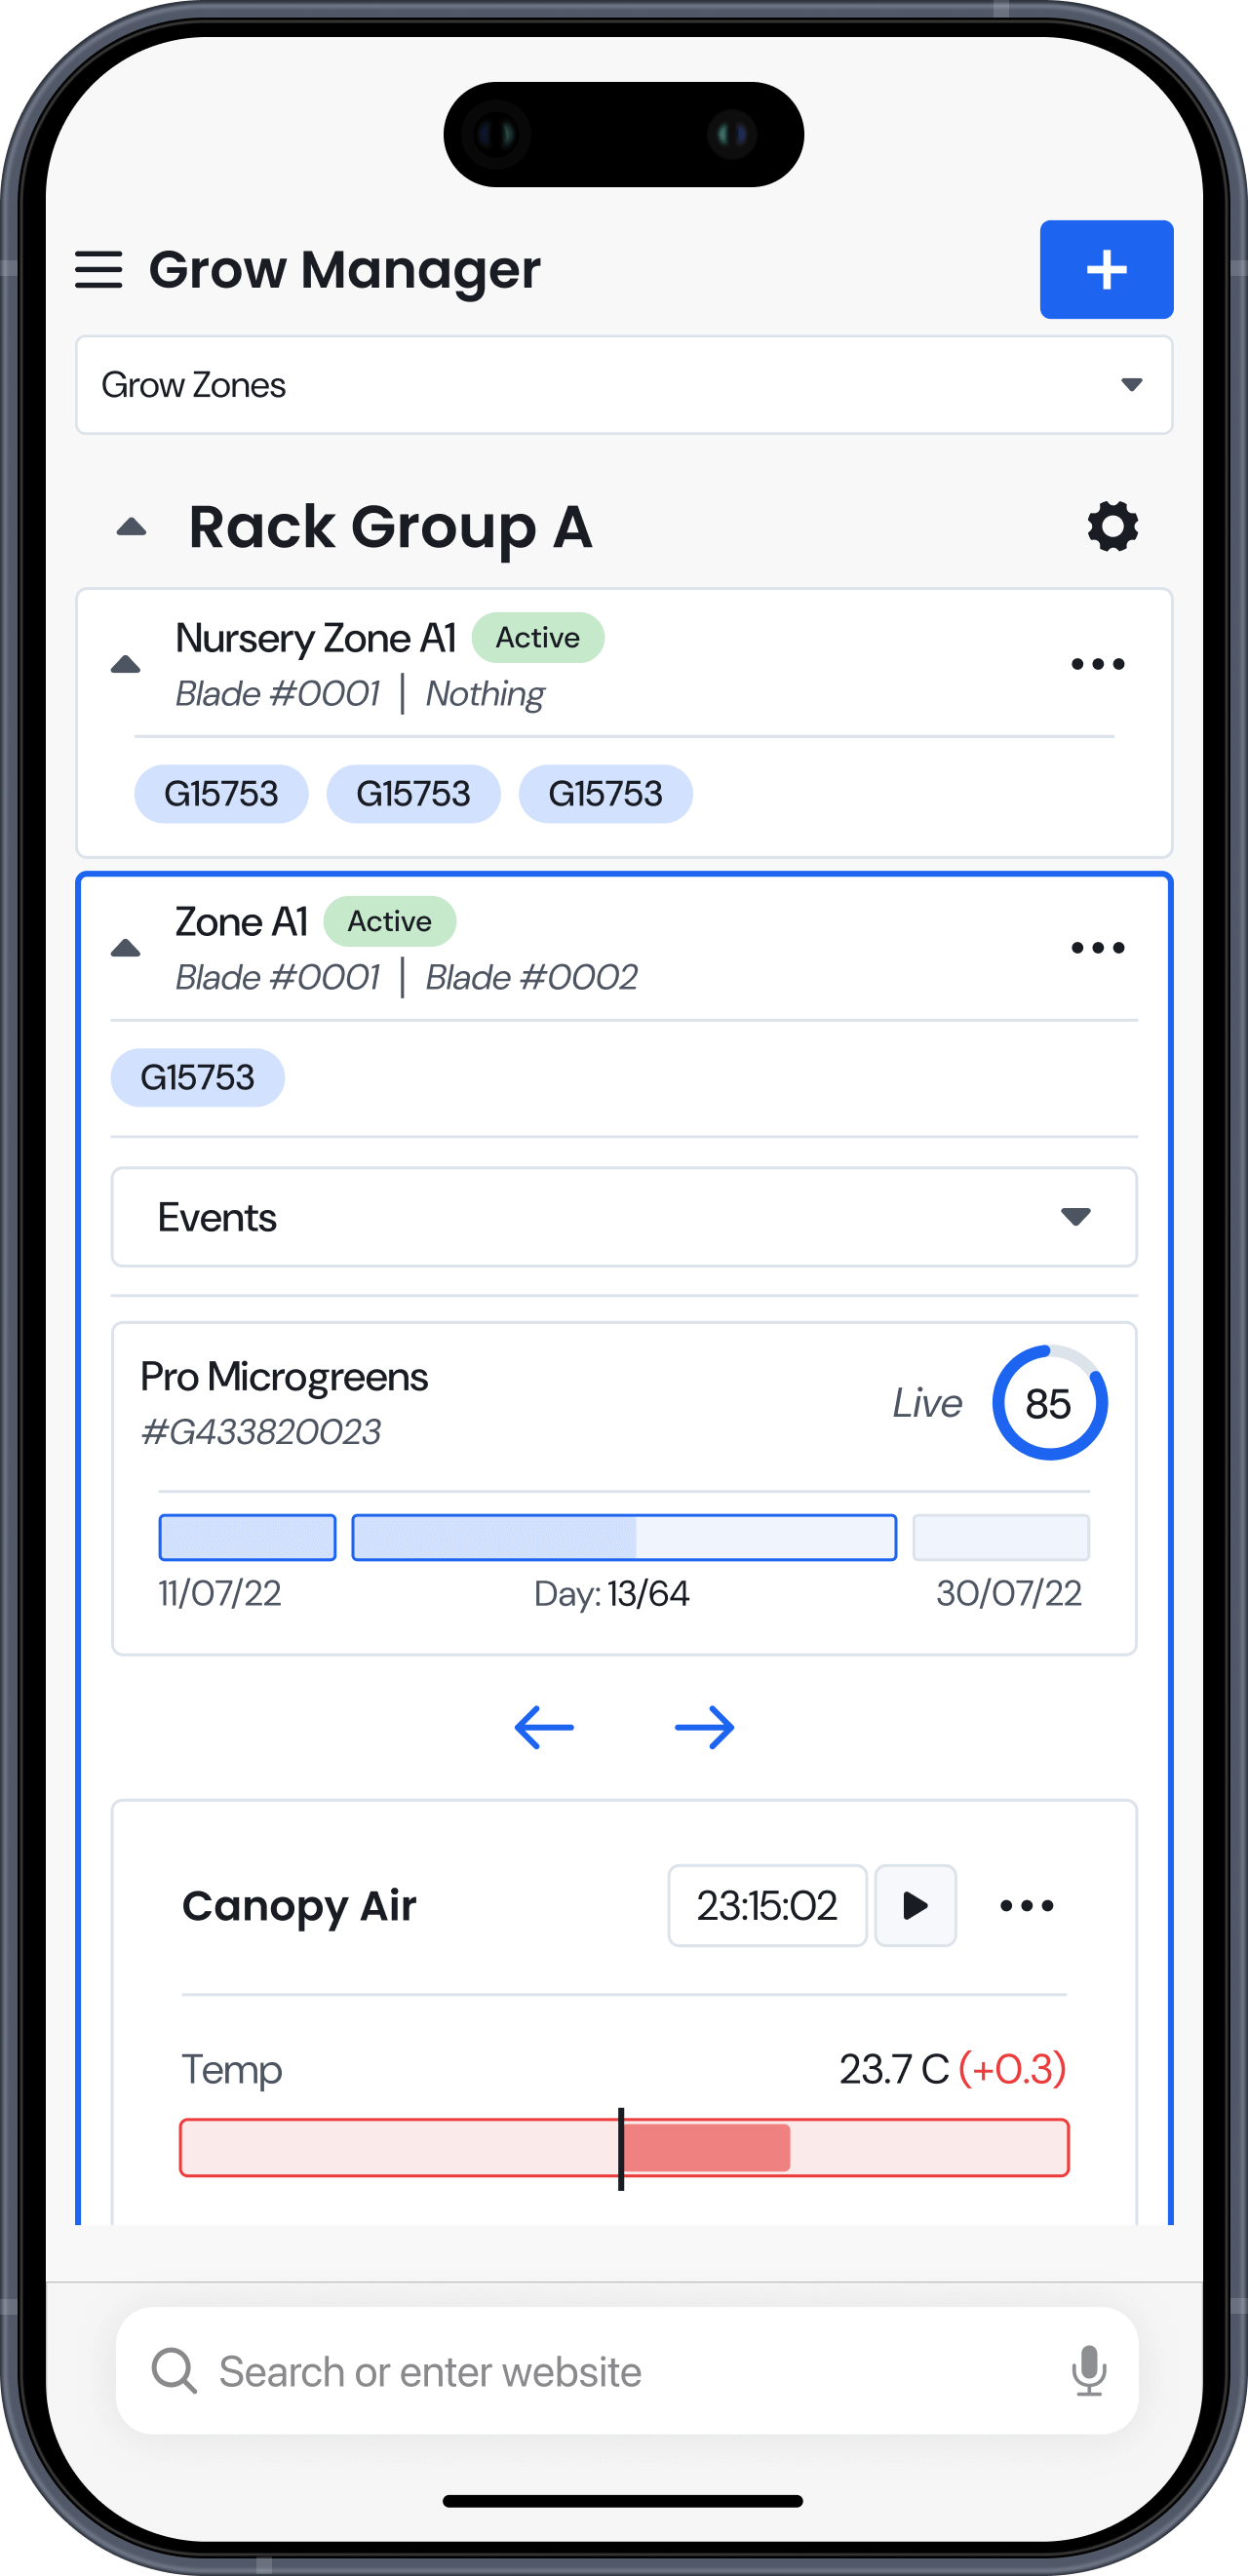
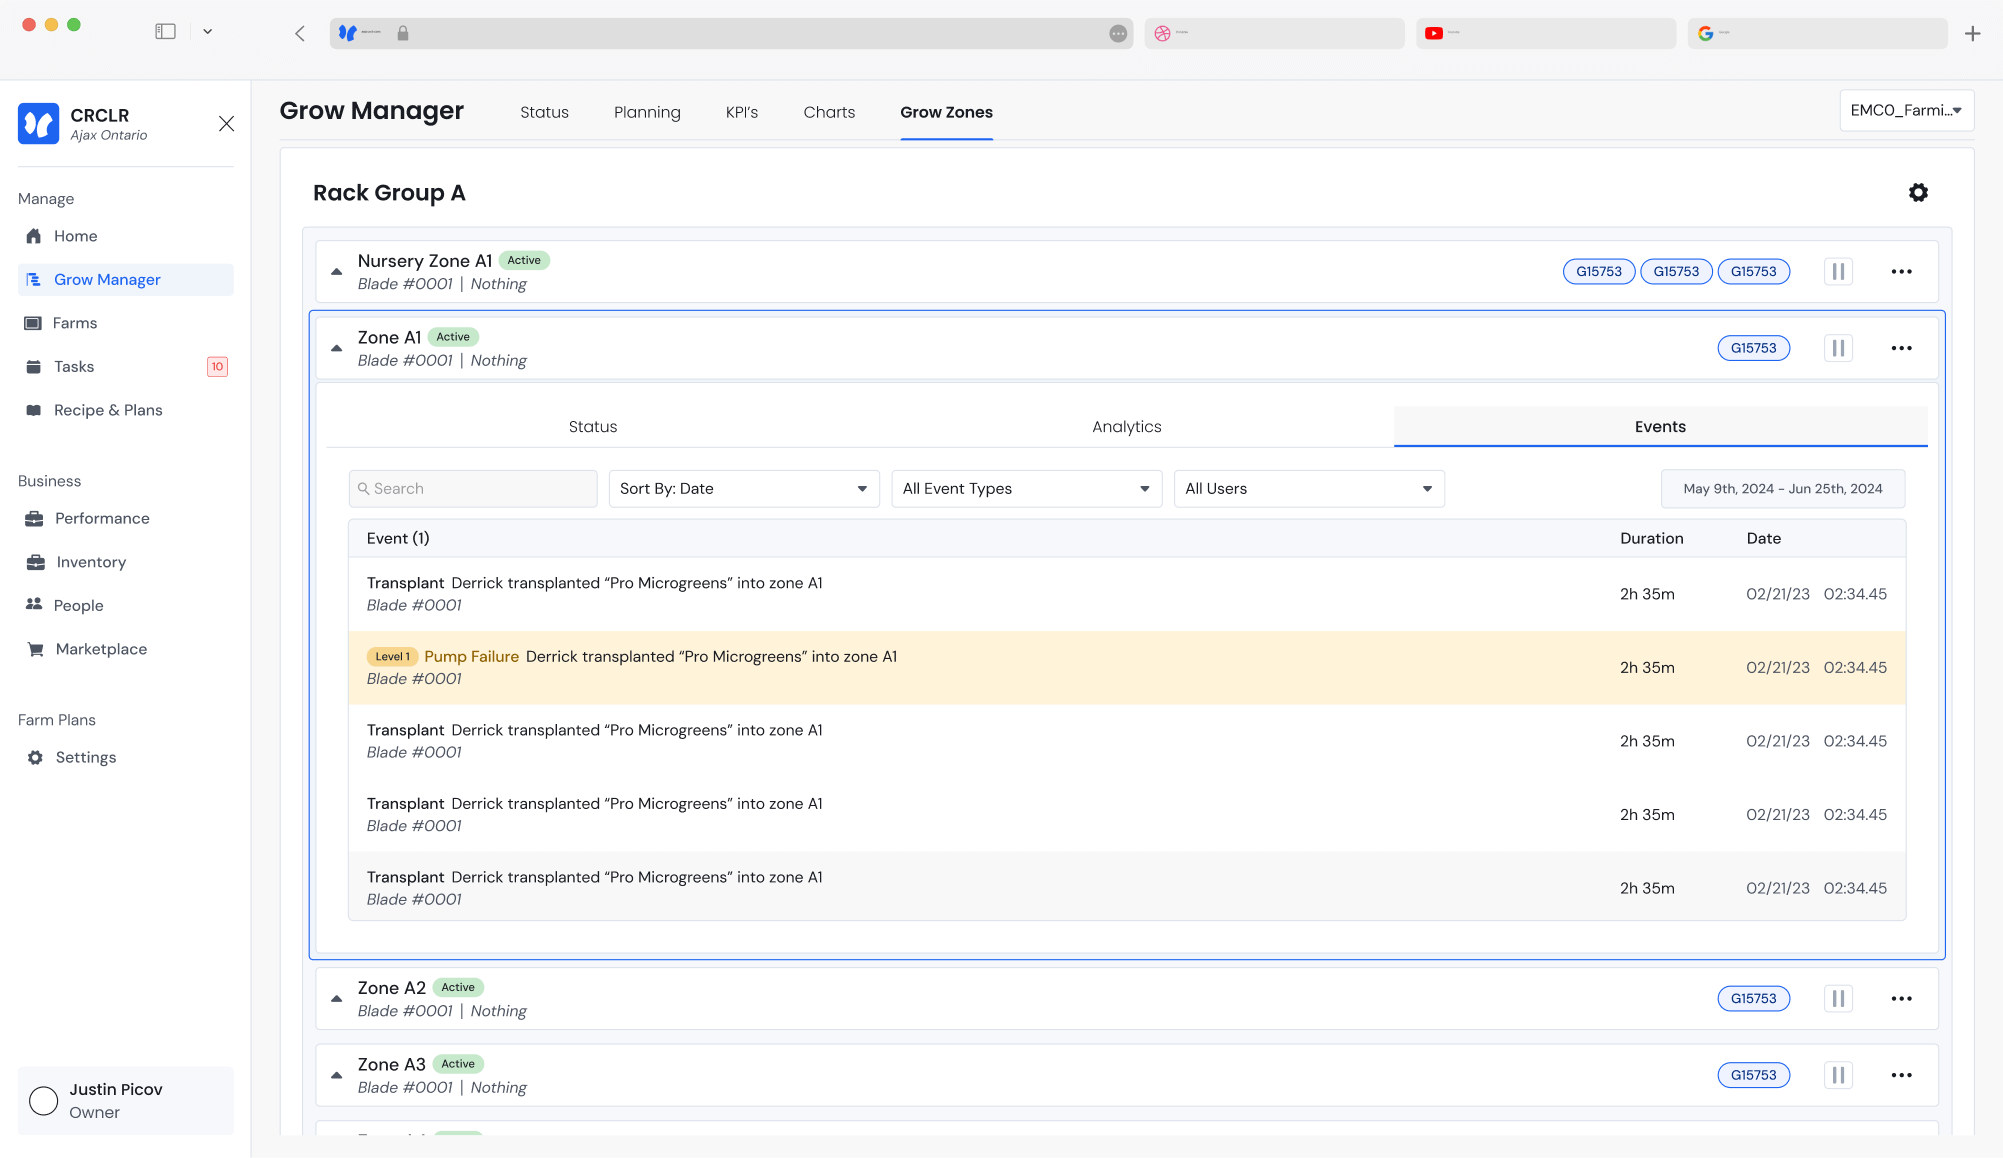
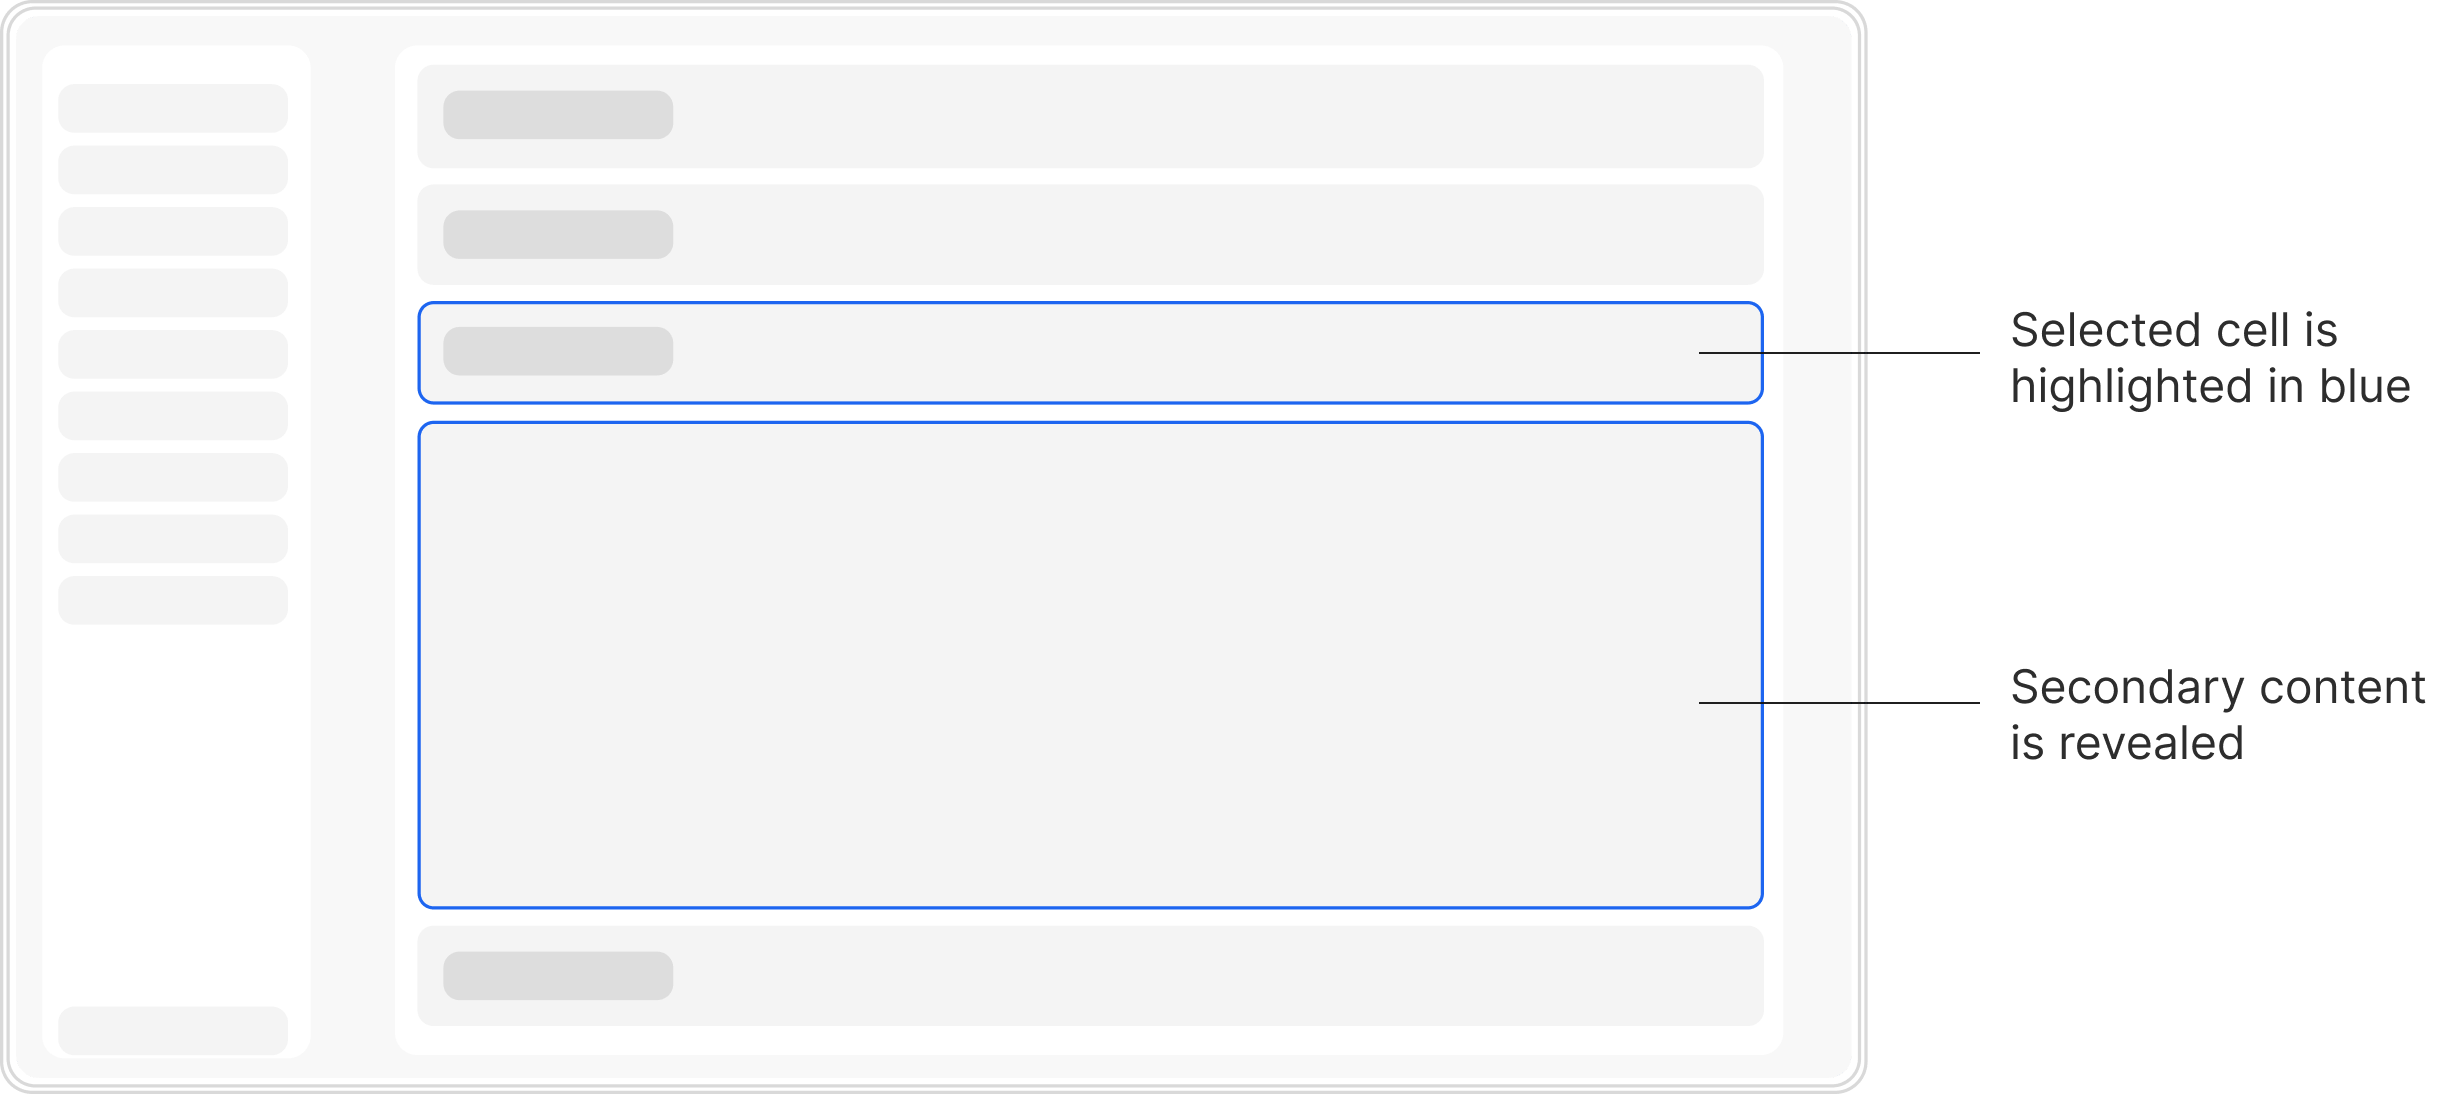
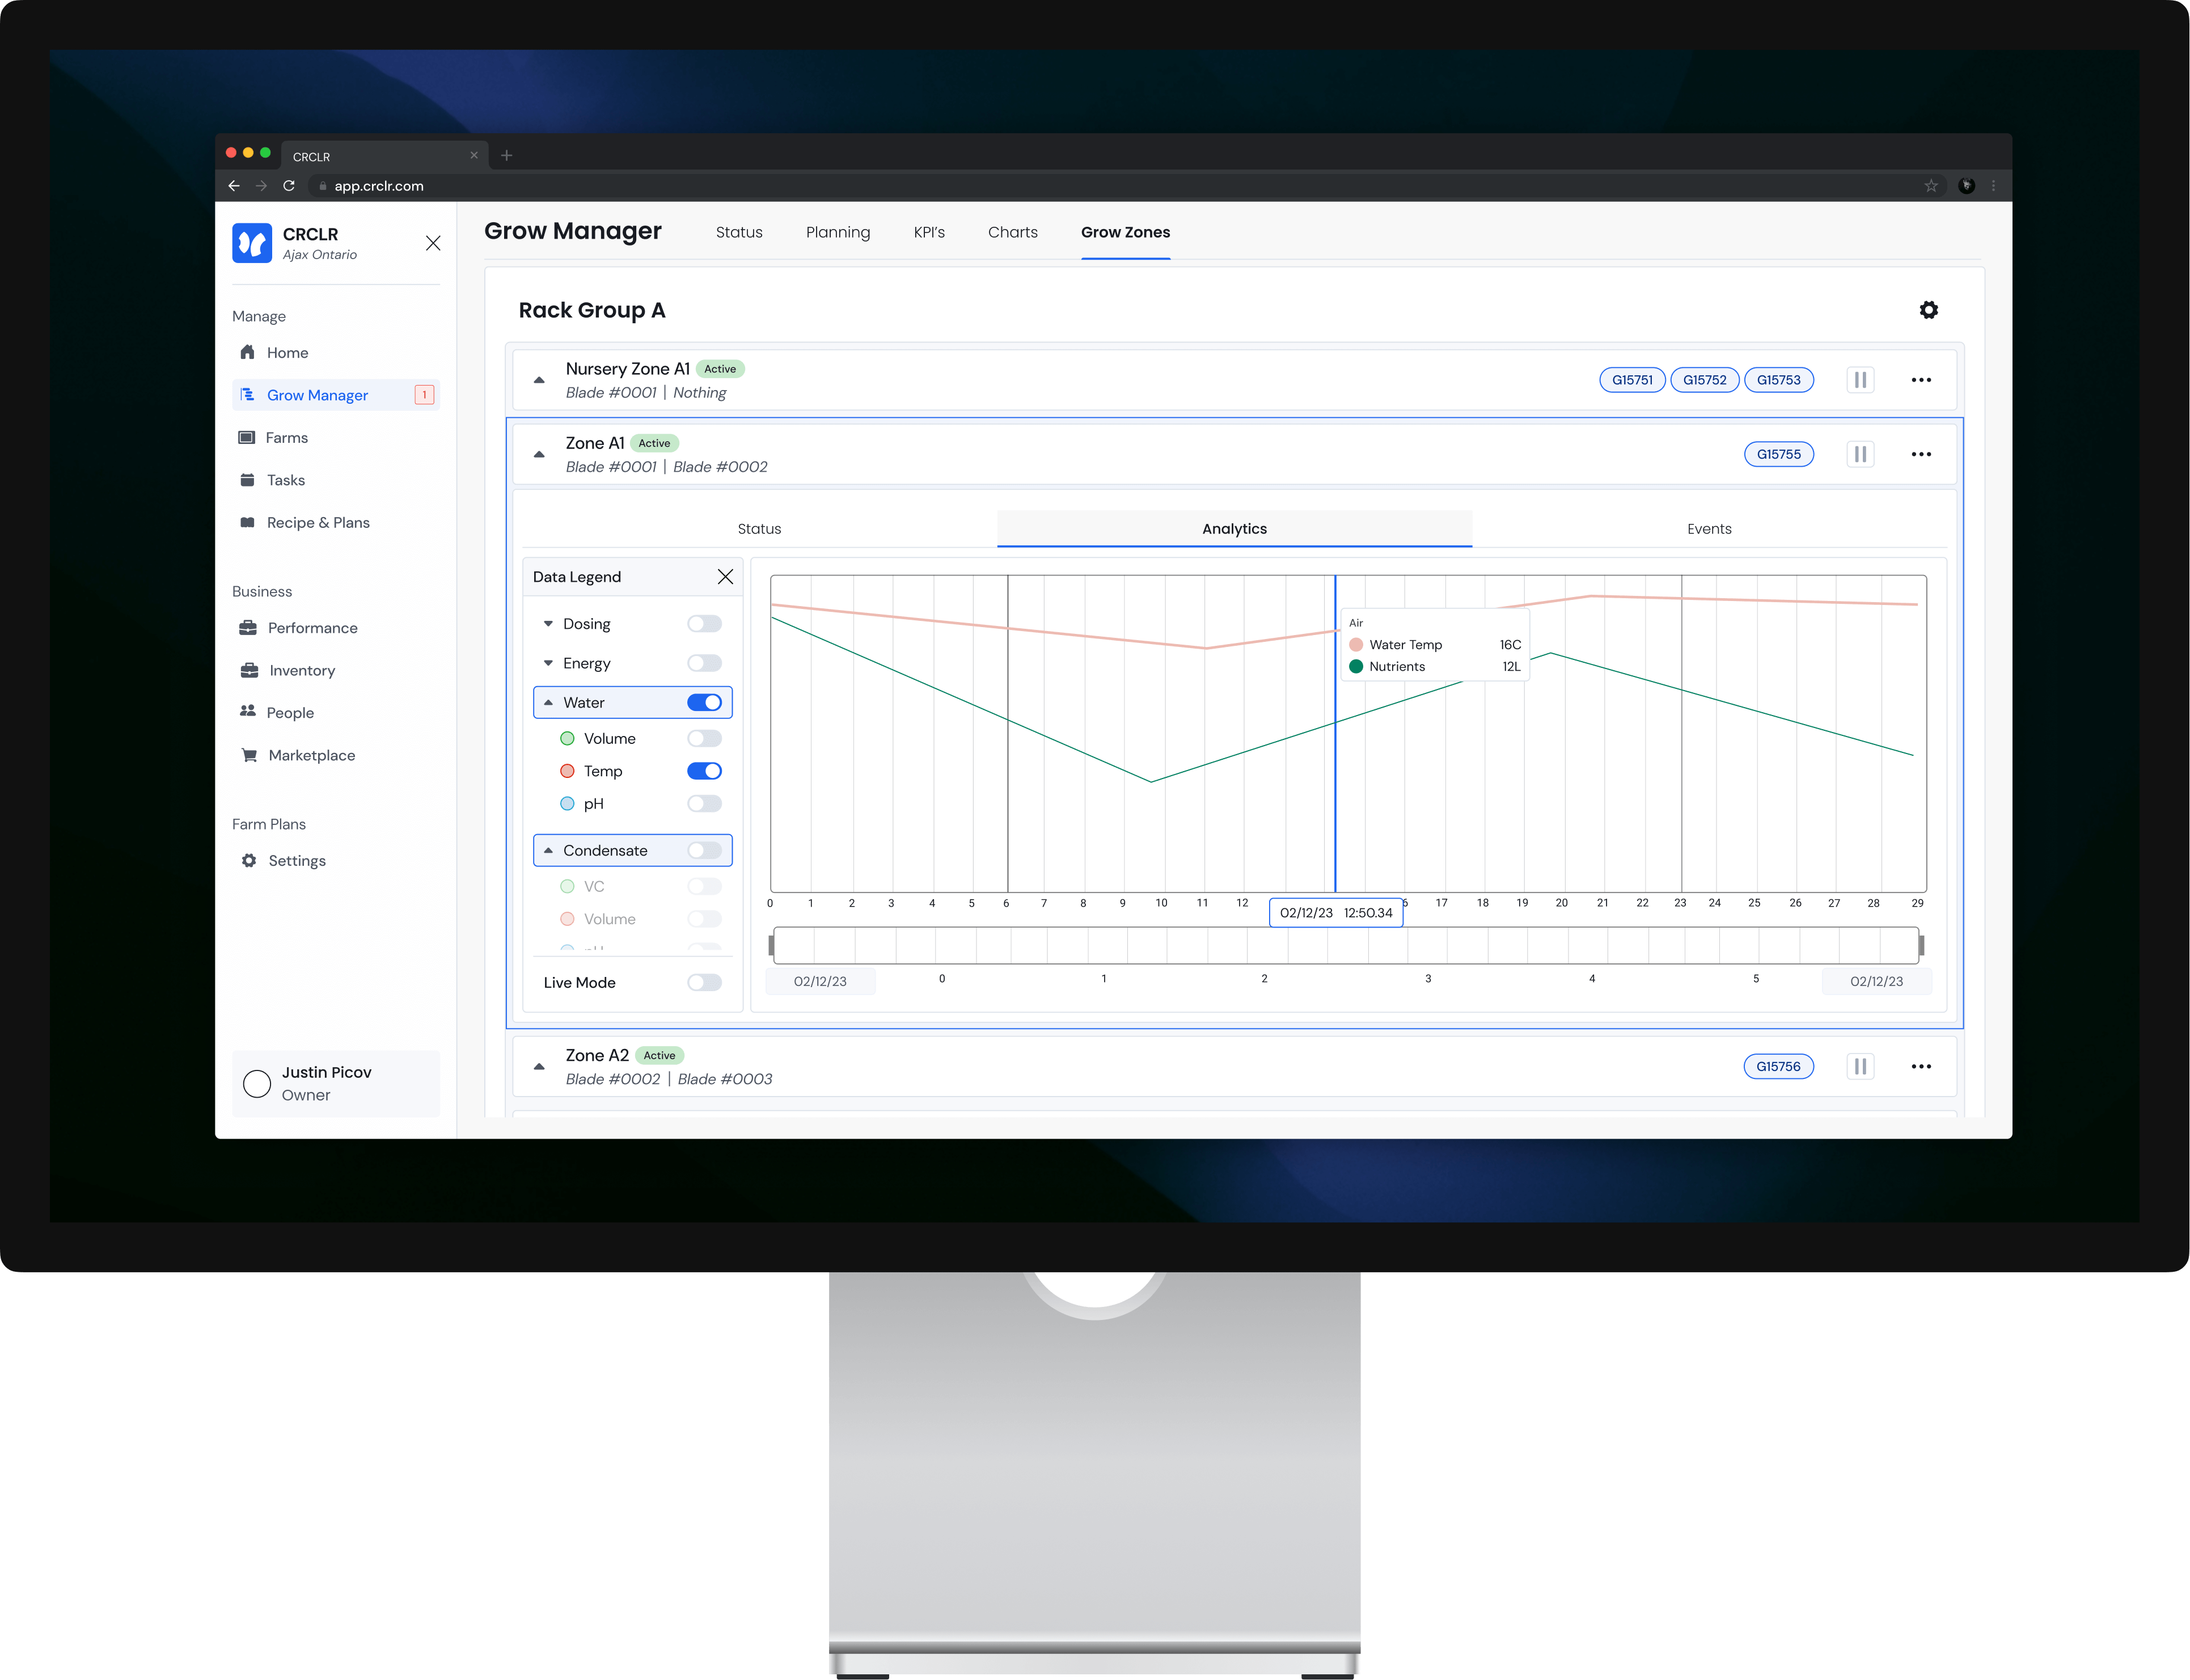
Opening a cell reveals a deeper dive into the zone’s active progress. The analytics page, as shown, provides historical data of the zone’s performance allowing users to identify & troubleshoot issues.
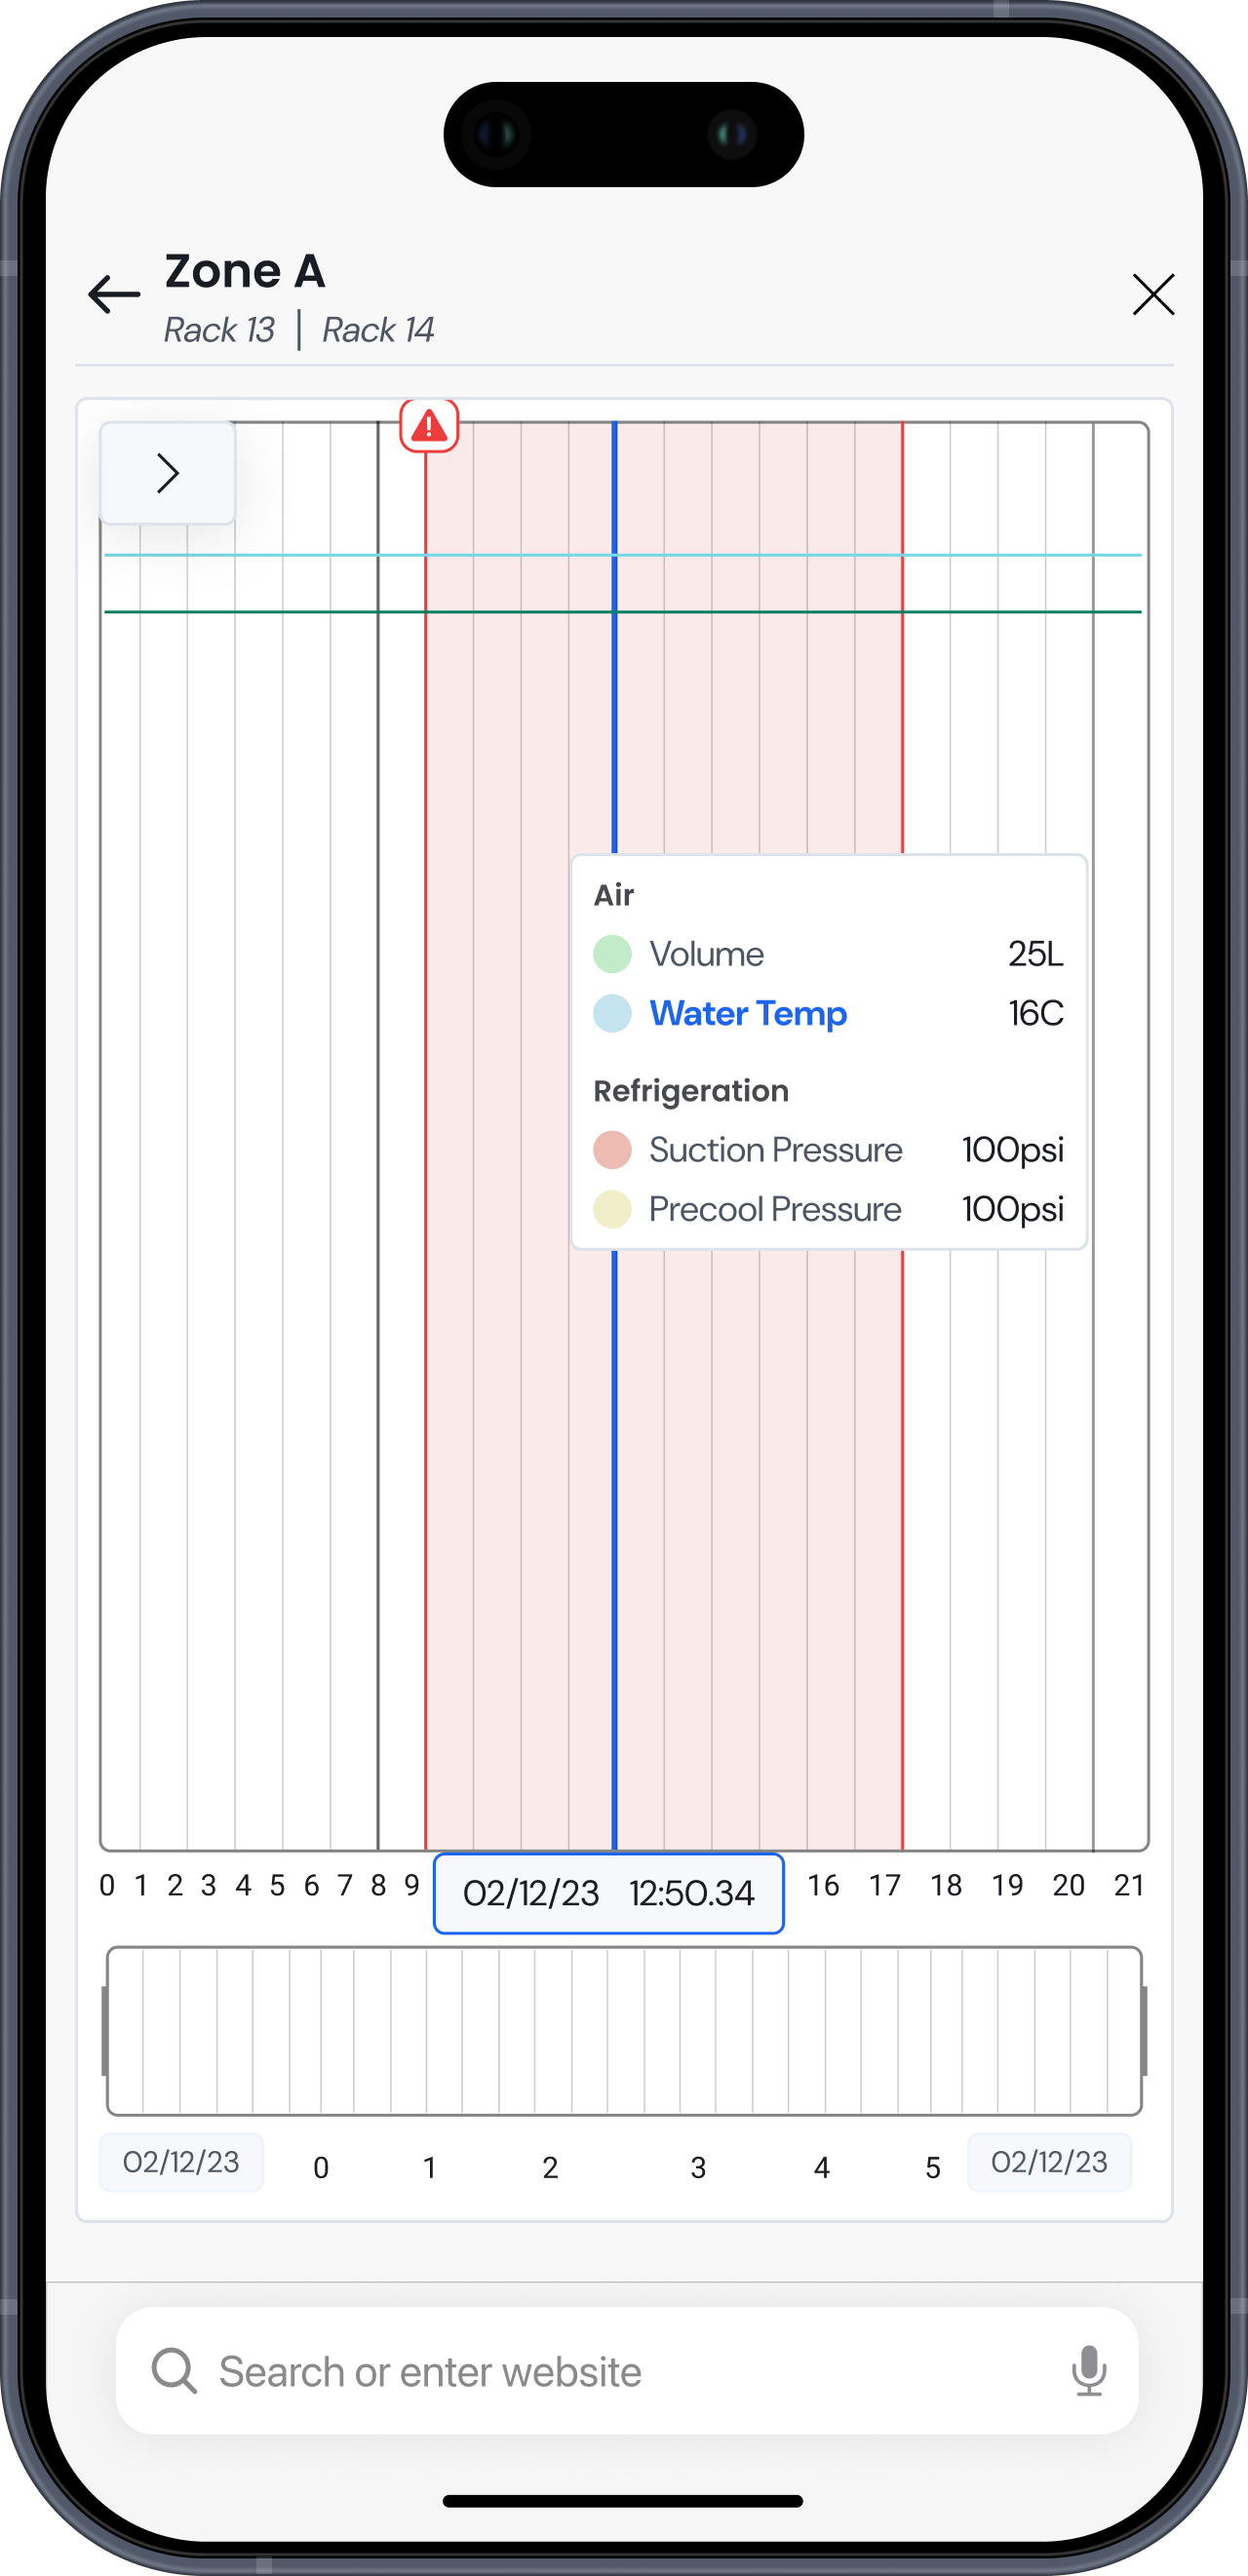
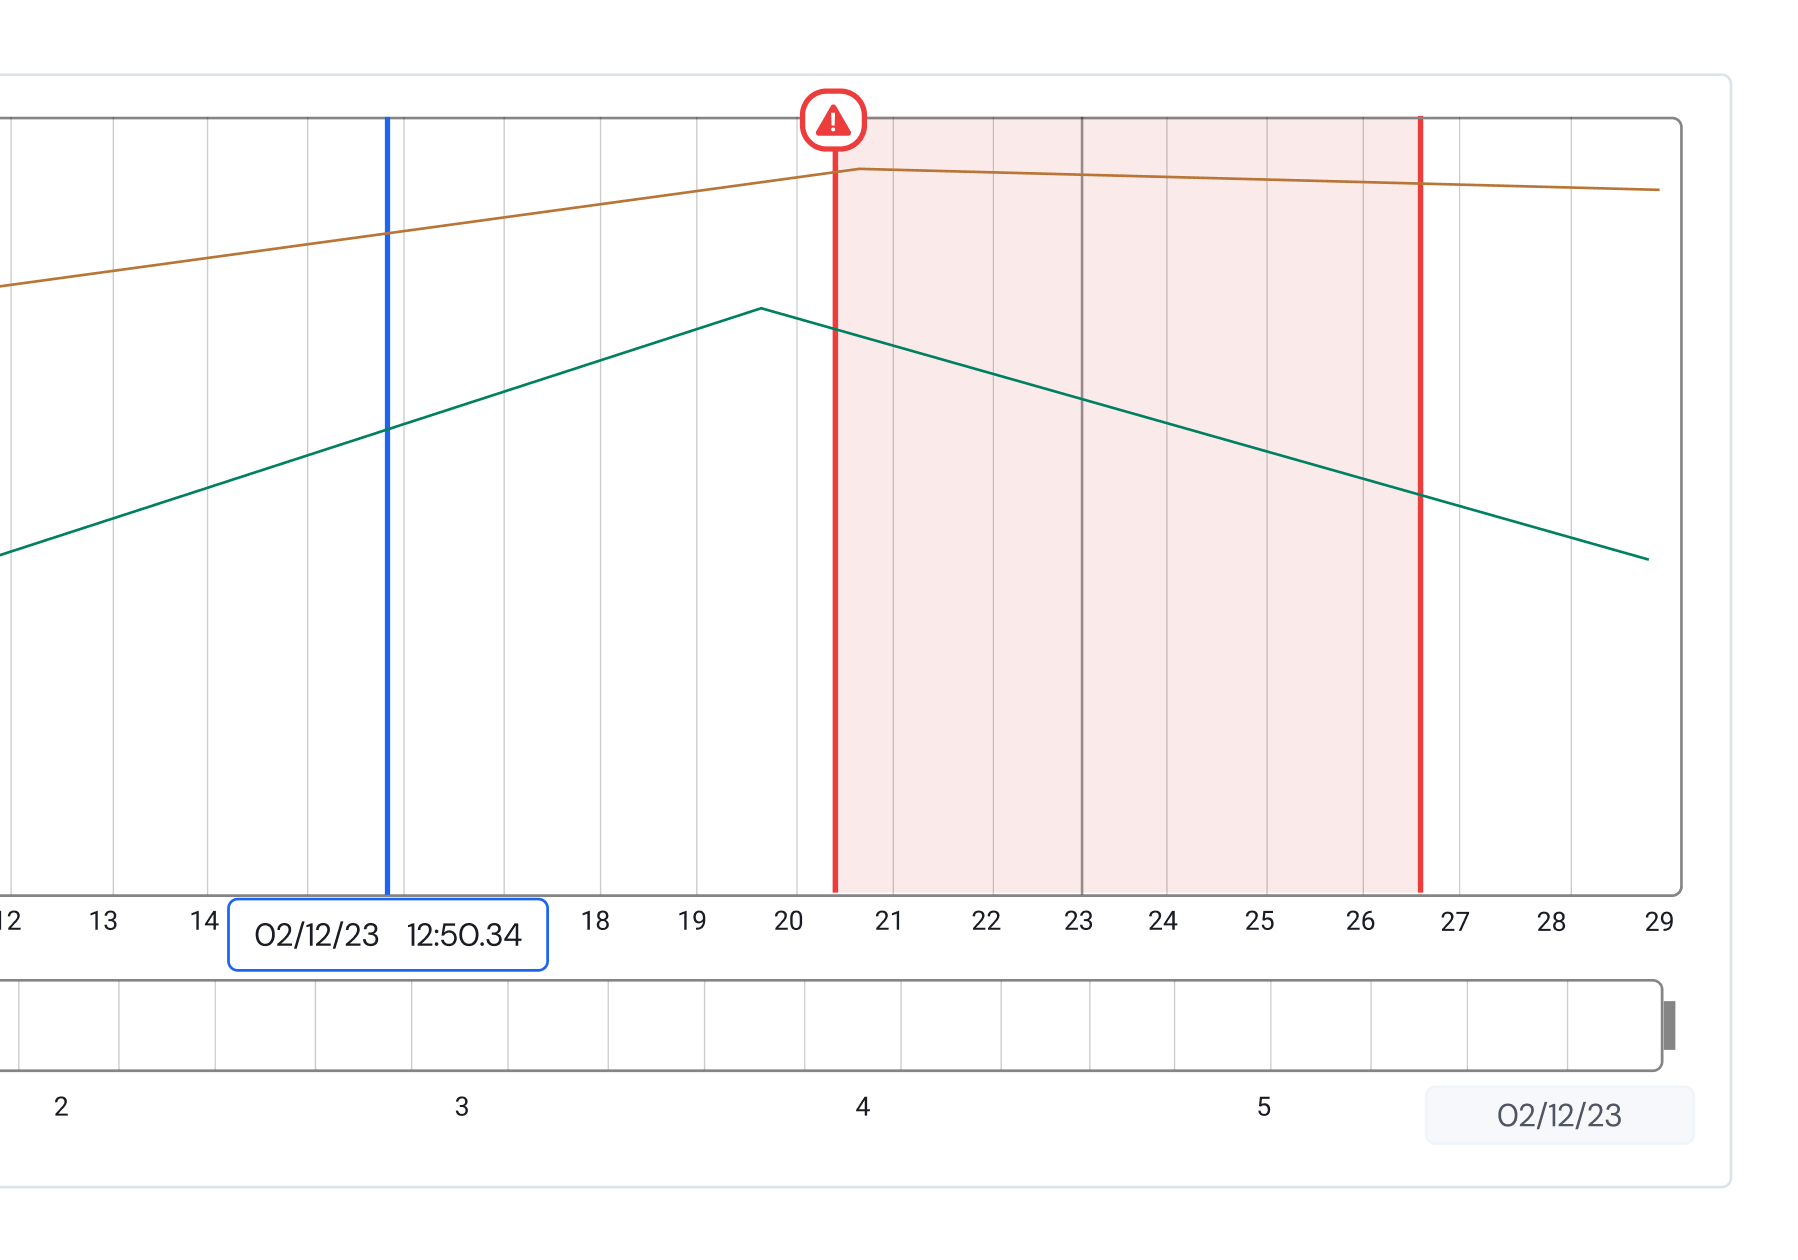
The analytics offer clear clickable call outs for detected down time. Allowing issues to be identified quickly & be accessed on any type of device.
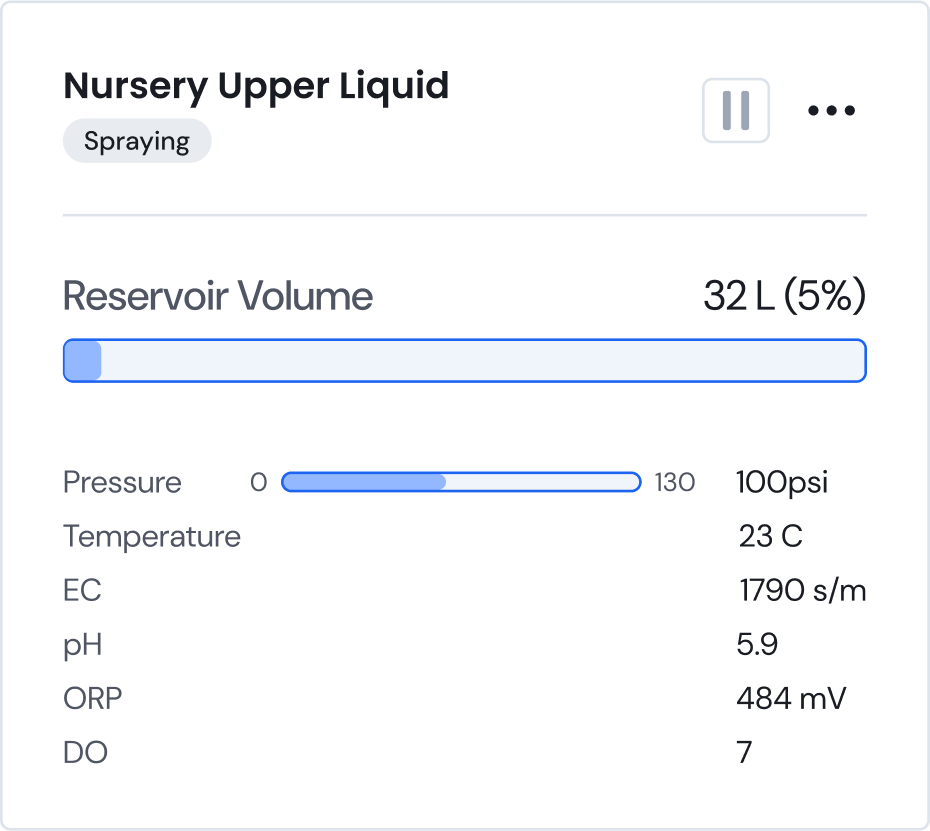
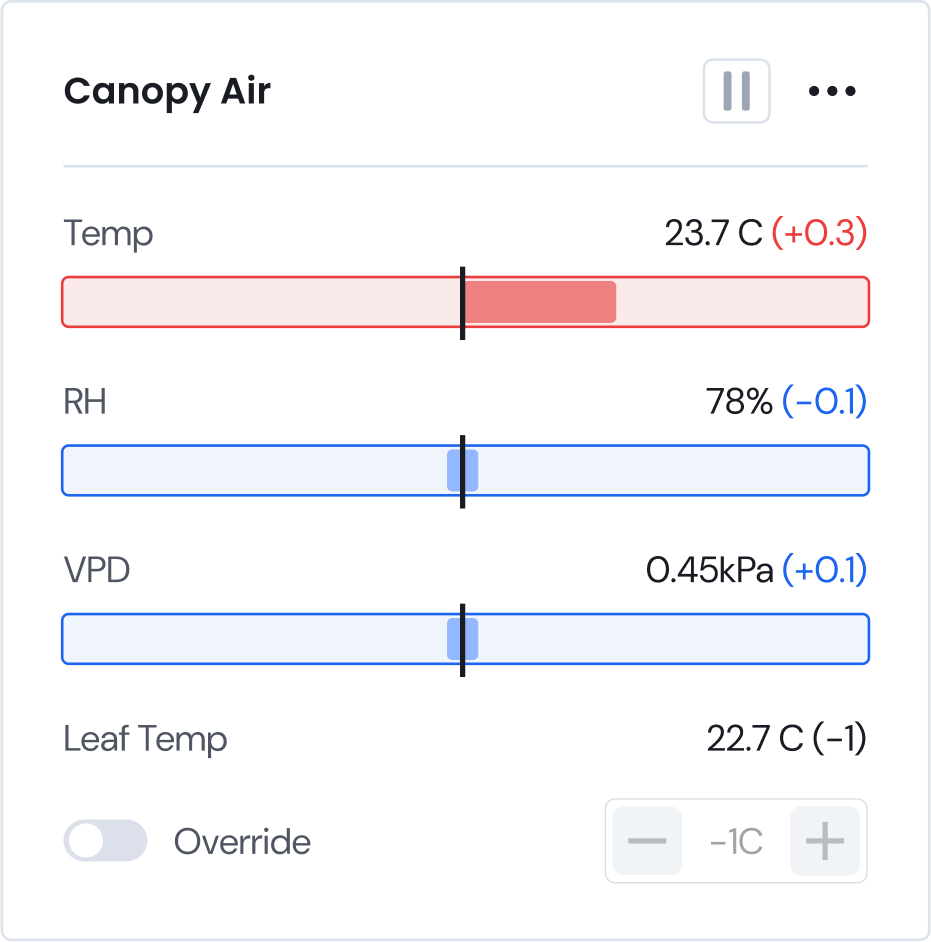
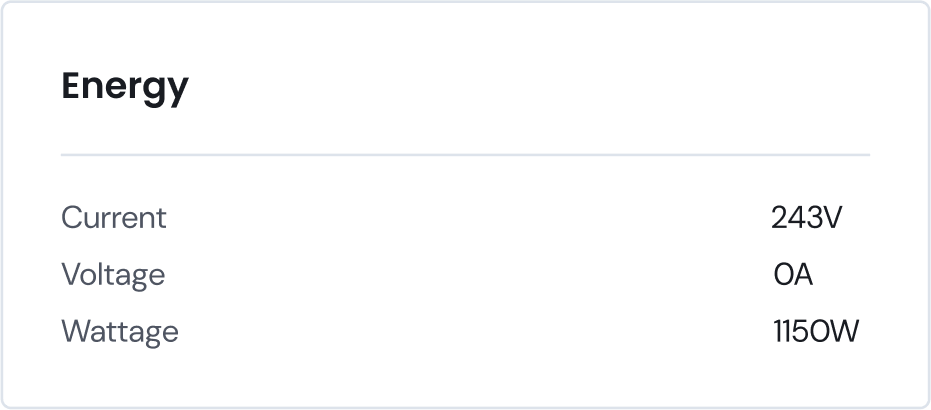
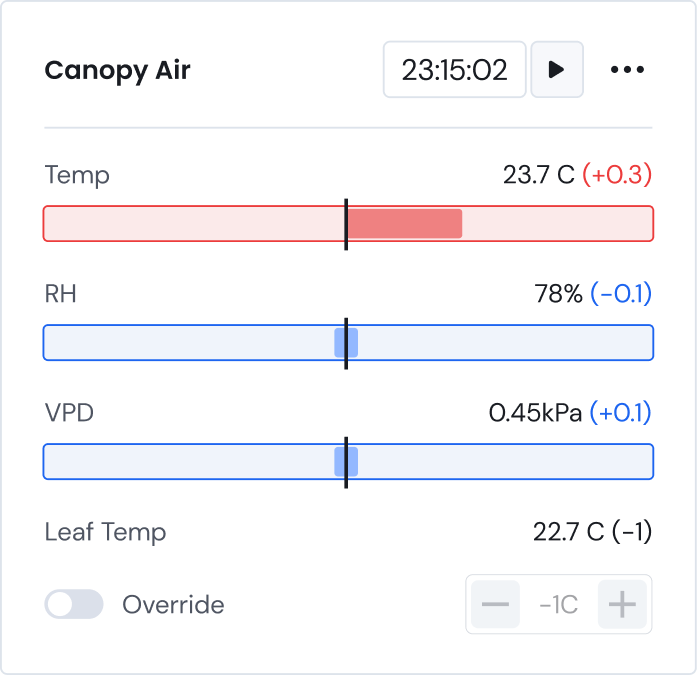
For more info on live performance, the zone status page is where they can see how the zone is physically performing compared to the expected instructions.
The zone management page give users key info as to their farms activity at a glance. Both colours & text inform the users of zone activity, issues, active grows & more.
For more info on live performance, the zone status page is where they can see how the zone is physically performing compared to the expected instructions.
The analytics offer clear clickable call outs for detected down time. Allowing issues to be identified quickly & be accessed on any type of device.
Opening a cell reveals a deeper dive into the zone’s active progress. The analytics page, as shown, provides historical data of the zone’s performance allowing users to identify & troubleshoot issues.
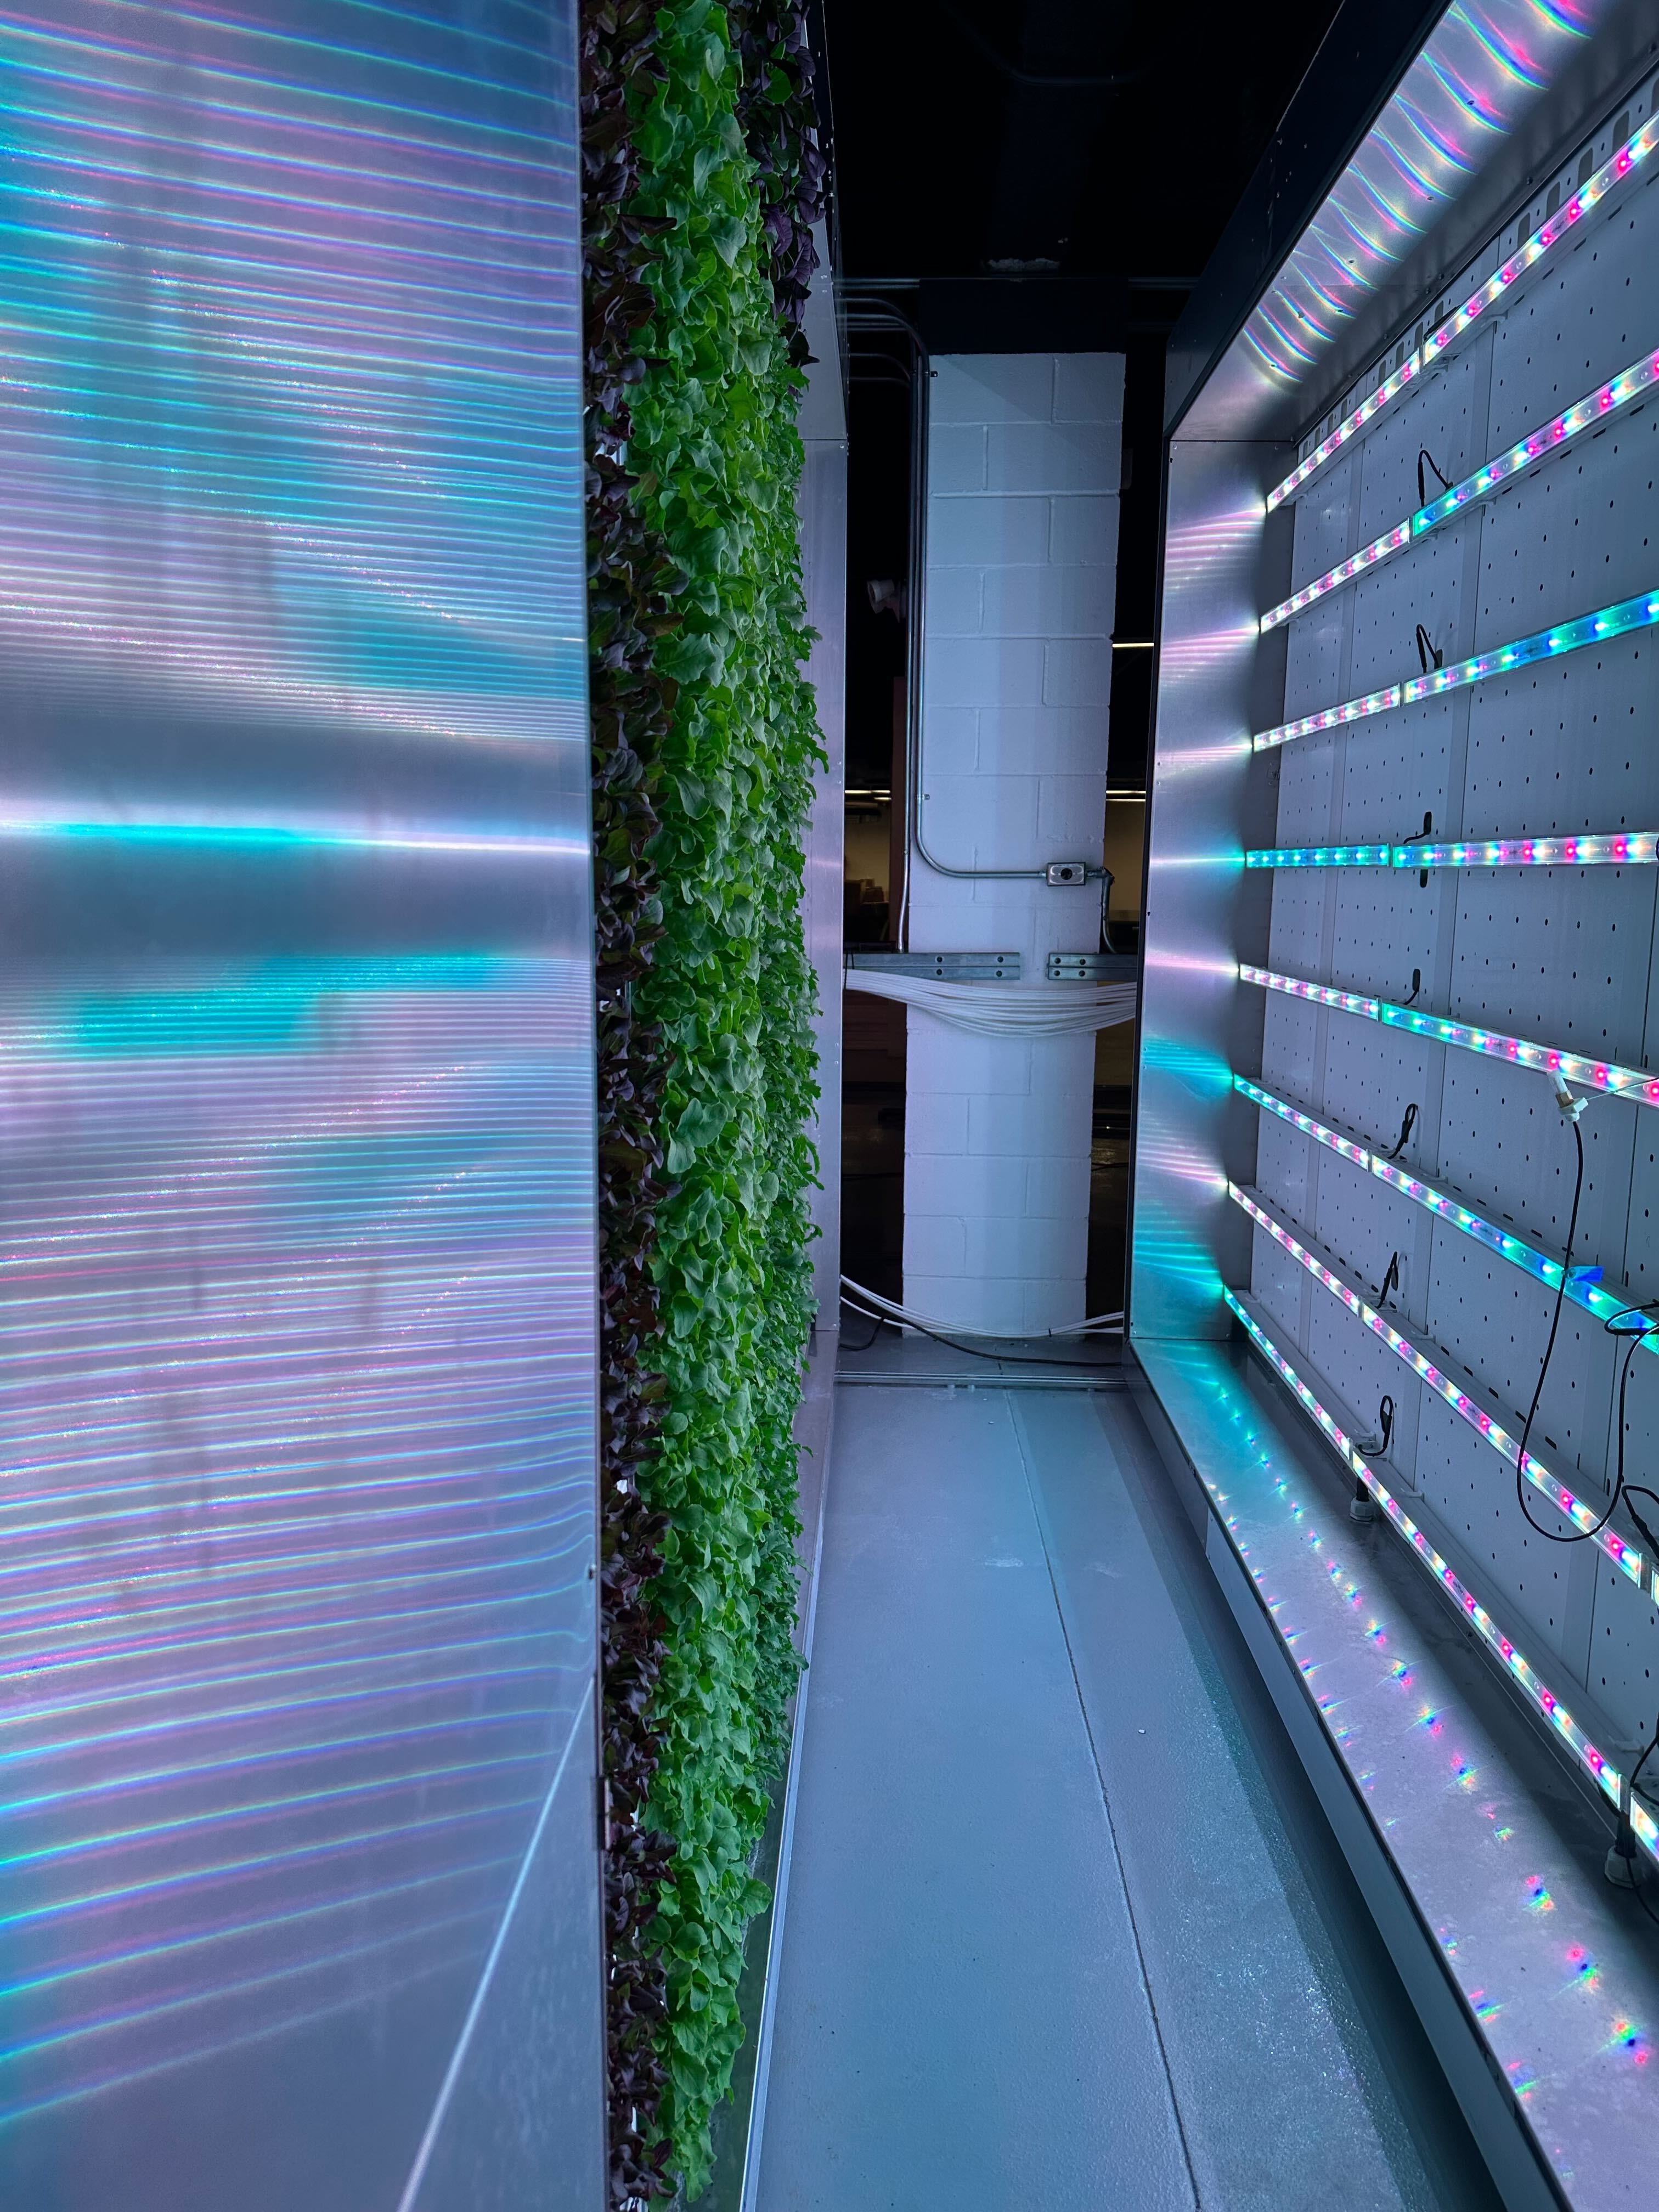
The CRCLR system is a series of movable racks, a nutrient distribution system and a software that allows users to manage indoor farms. These farms operate year round controlling all possible environmental variables such as temperature, nutrients, humidity, light levels & more.
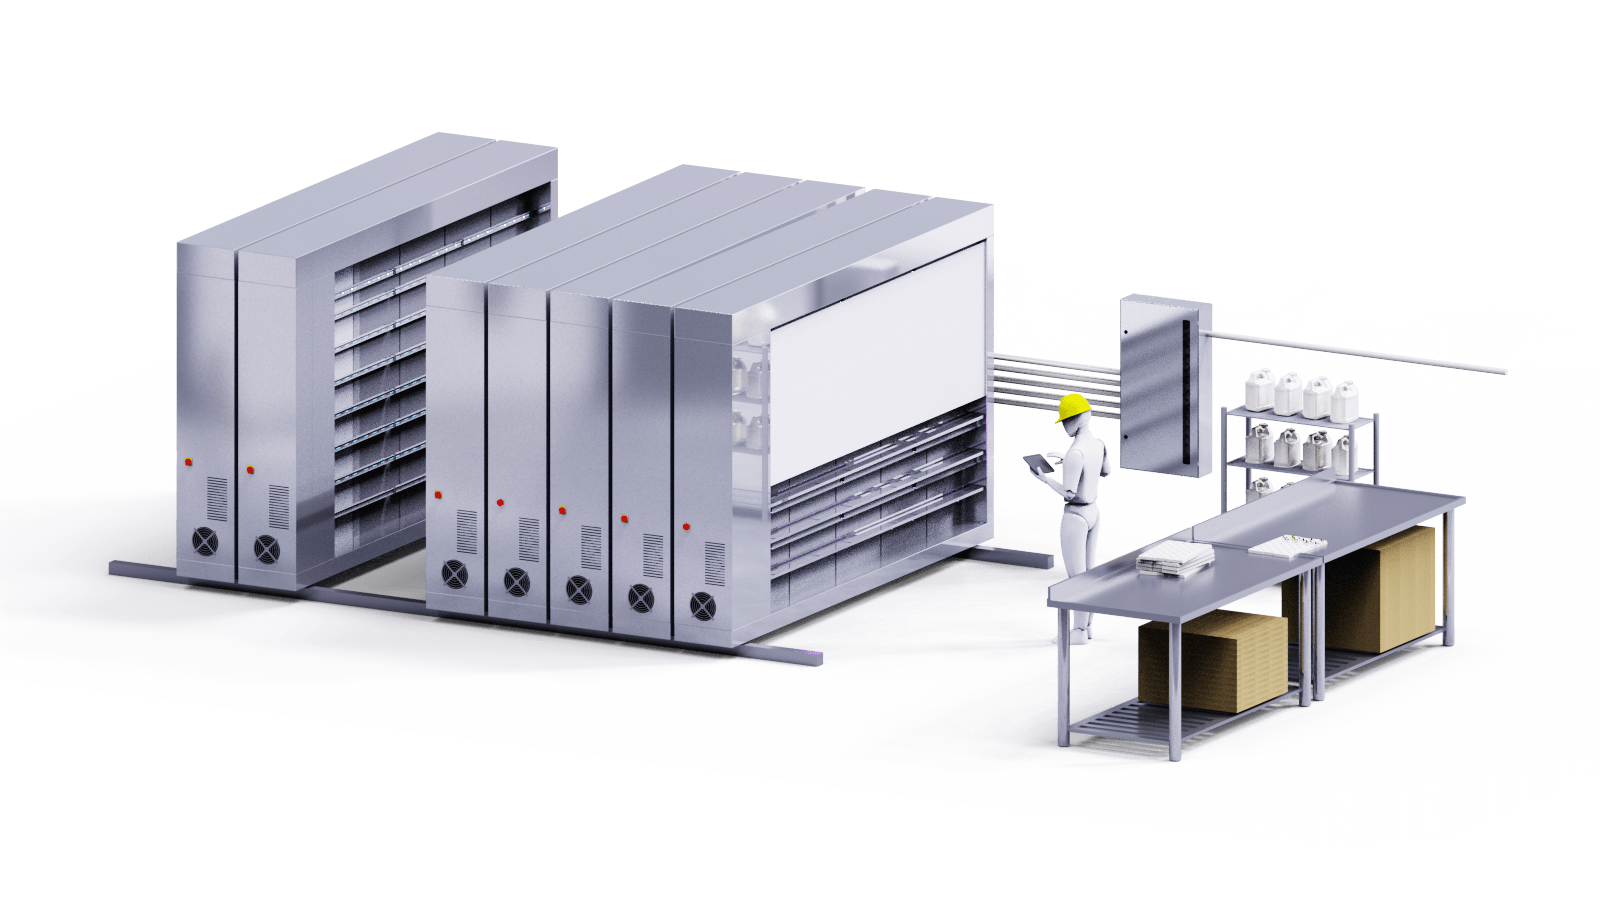
CRCLR as a brand aims to offer capable hardware & software packaged in a very sleek & easy to understand package. Important functions are always easily accessible with more niche specialized options hidden for users willing to dig.
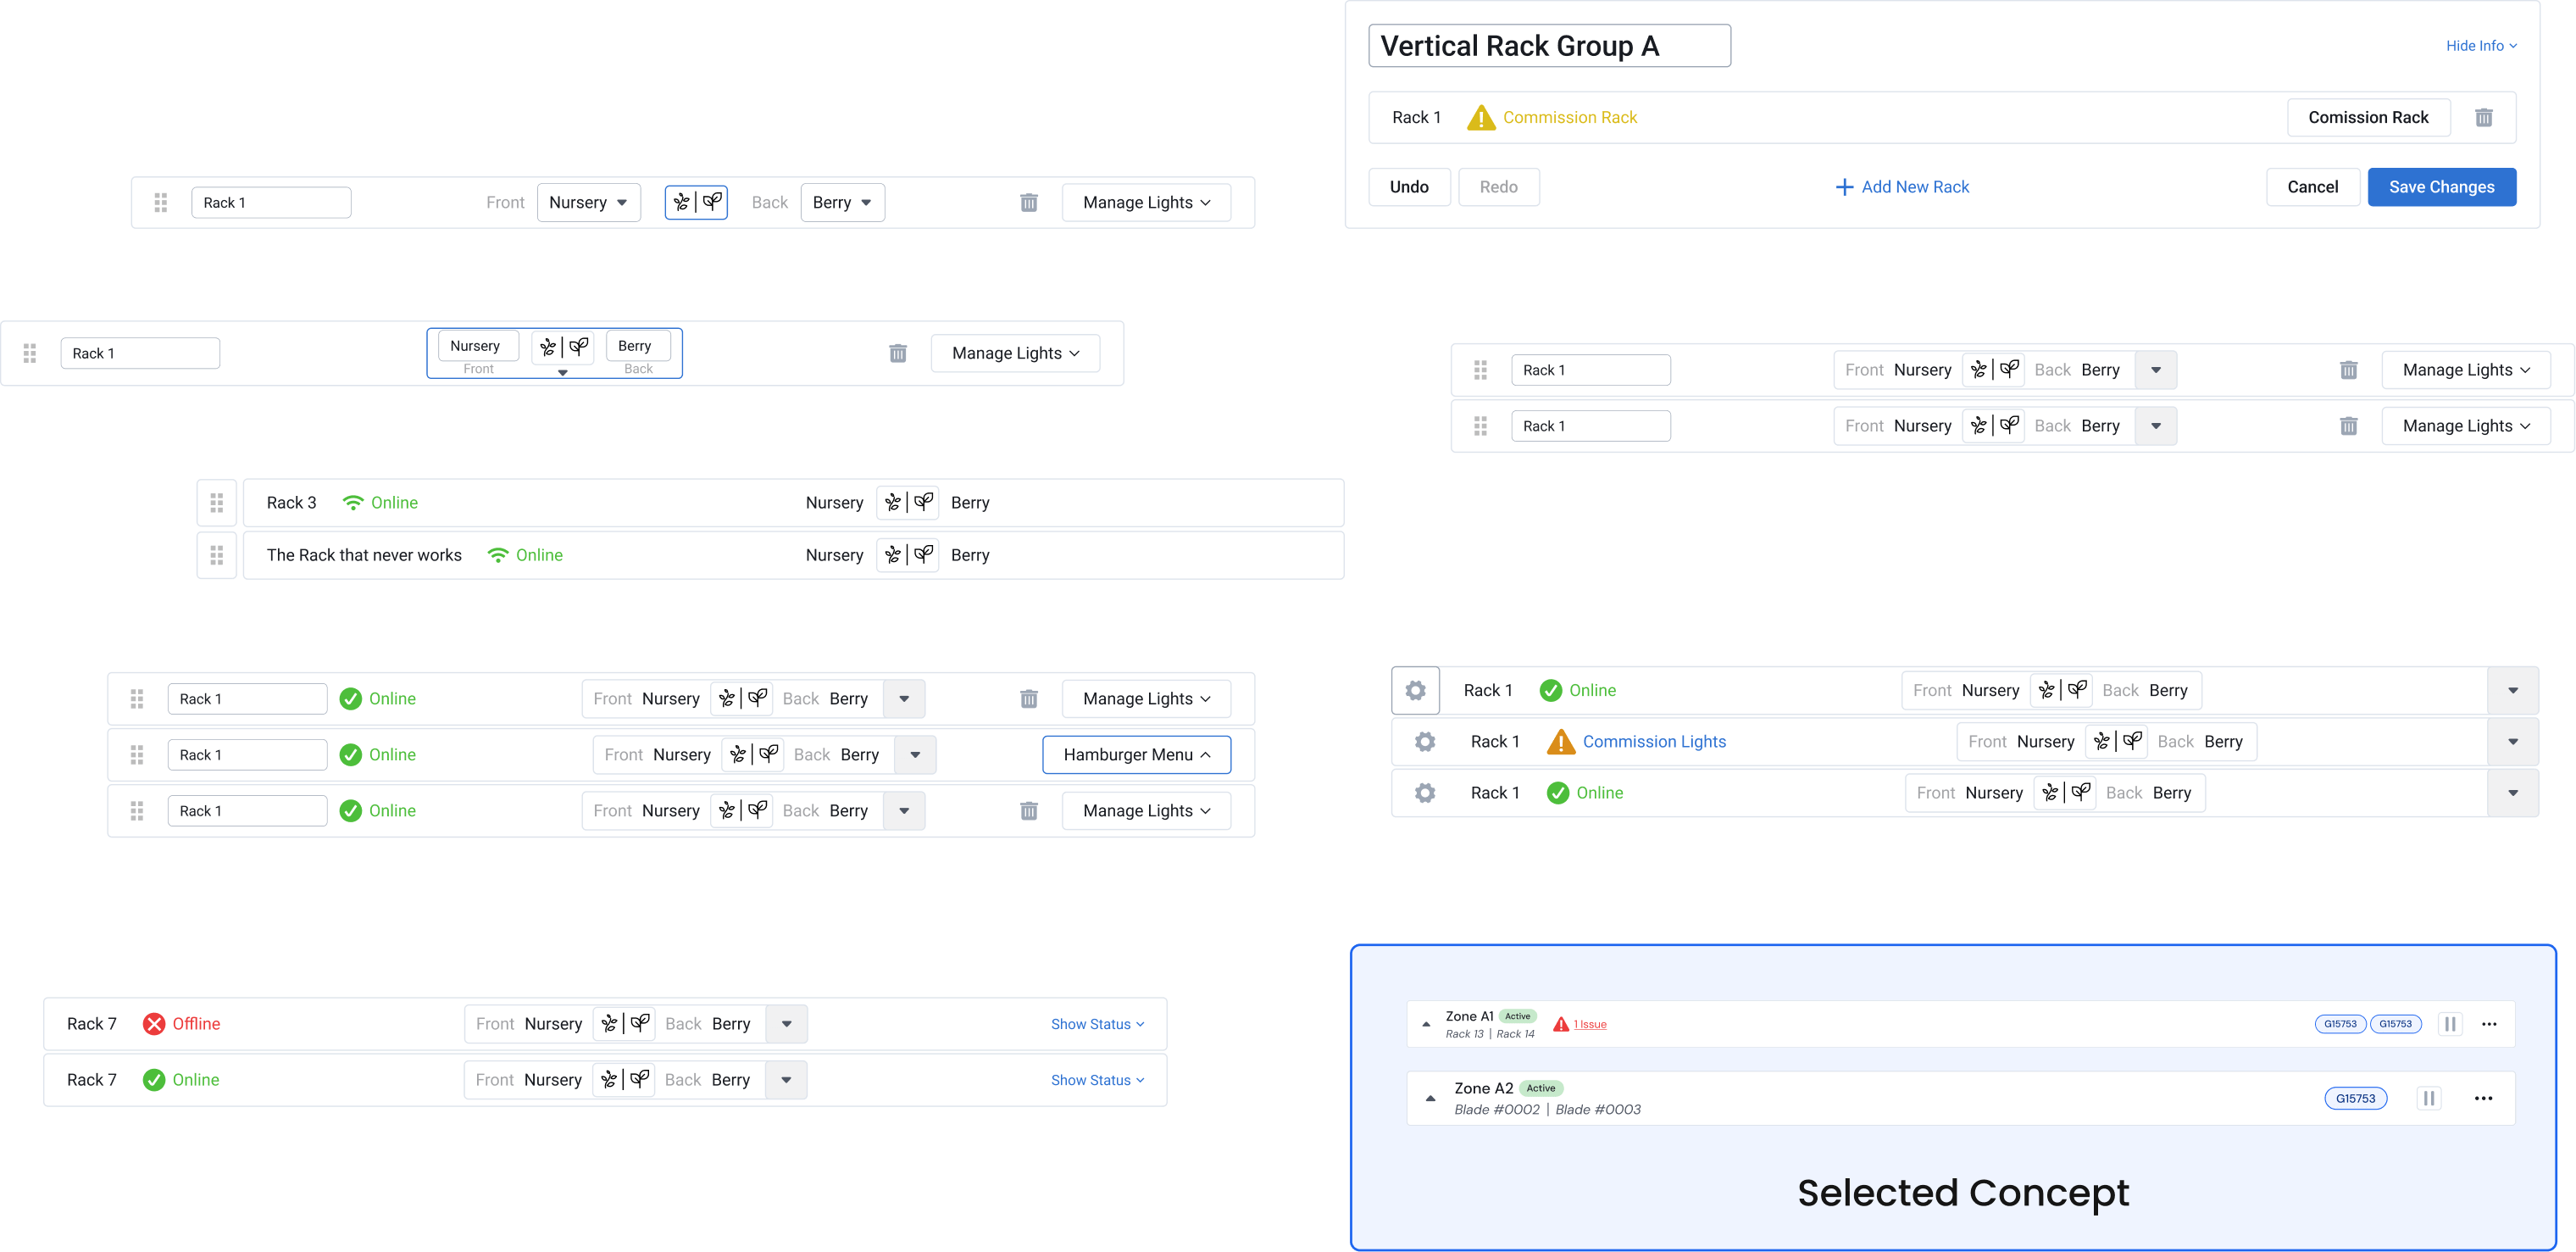
The concept for grow zone started when creating a troubleshooting feature for any hardware issues that may occur. This feature was intended to simplify issue detection for users but we found that even as the people designing the system, it was hard to wrap out head around locating the issue sources.

We realized the devices page is rarely used, instead, we were focused on the “space” between racks that was actually being controlled. This was when we realized there was a lot of valuable data that can be displayed in this space that warrants its own page.
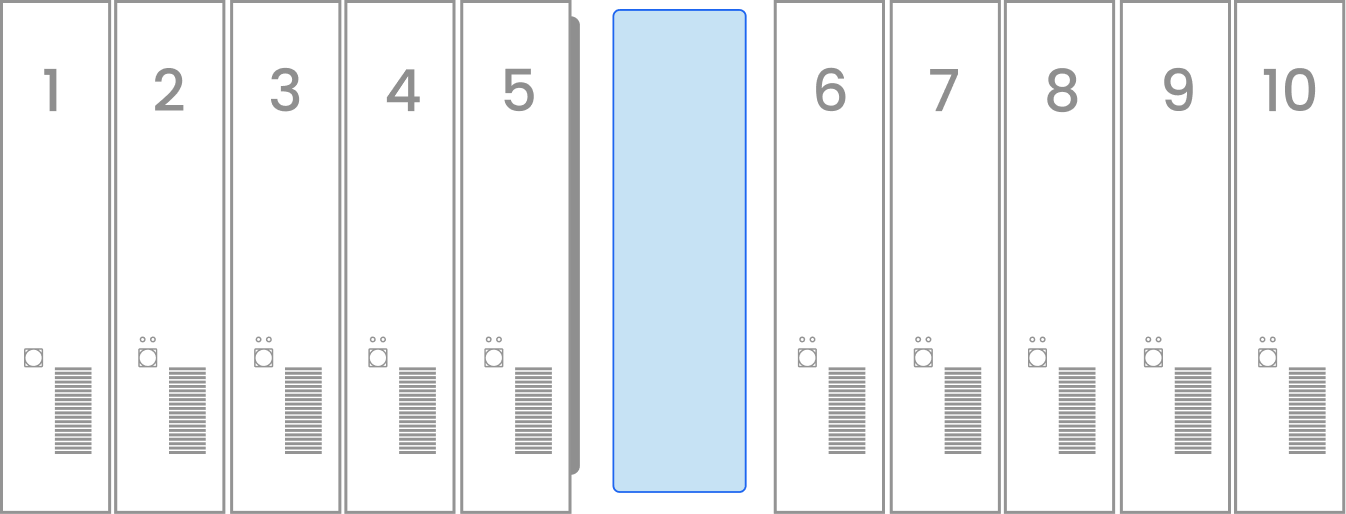
In a CRCLR farm, a grow zone is the space between two racks where plants grow. Users have full control over this space to manage air light & water variables. Within this space farmers can grow anything from greens to berries in ideal pesticide free conditions.
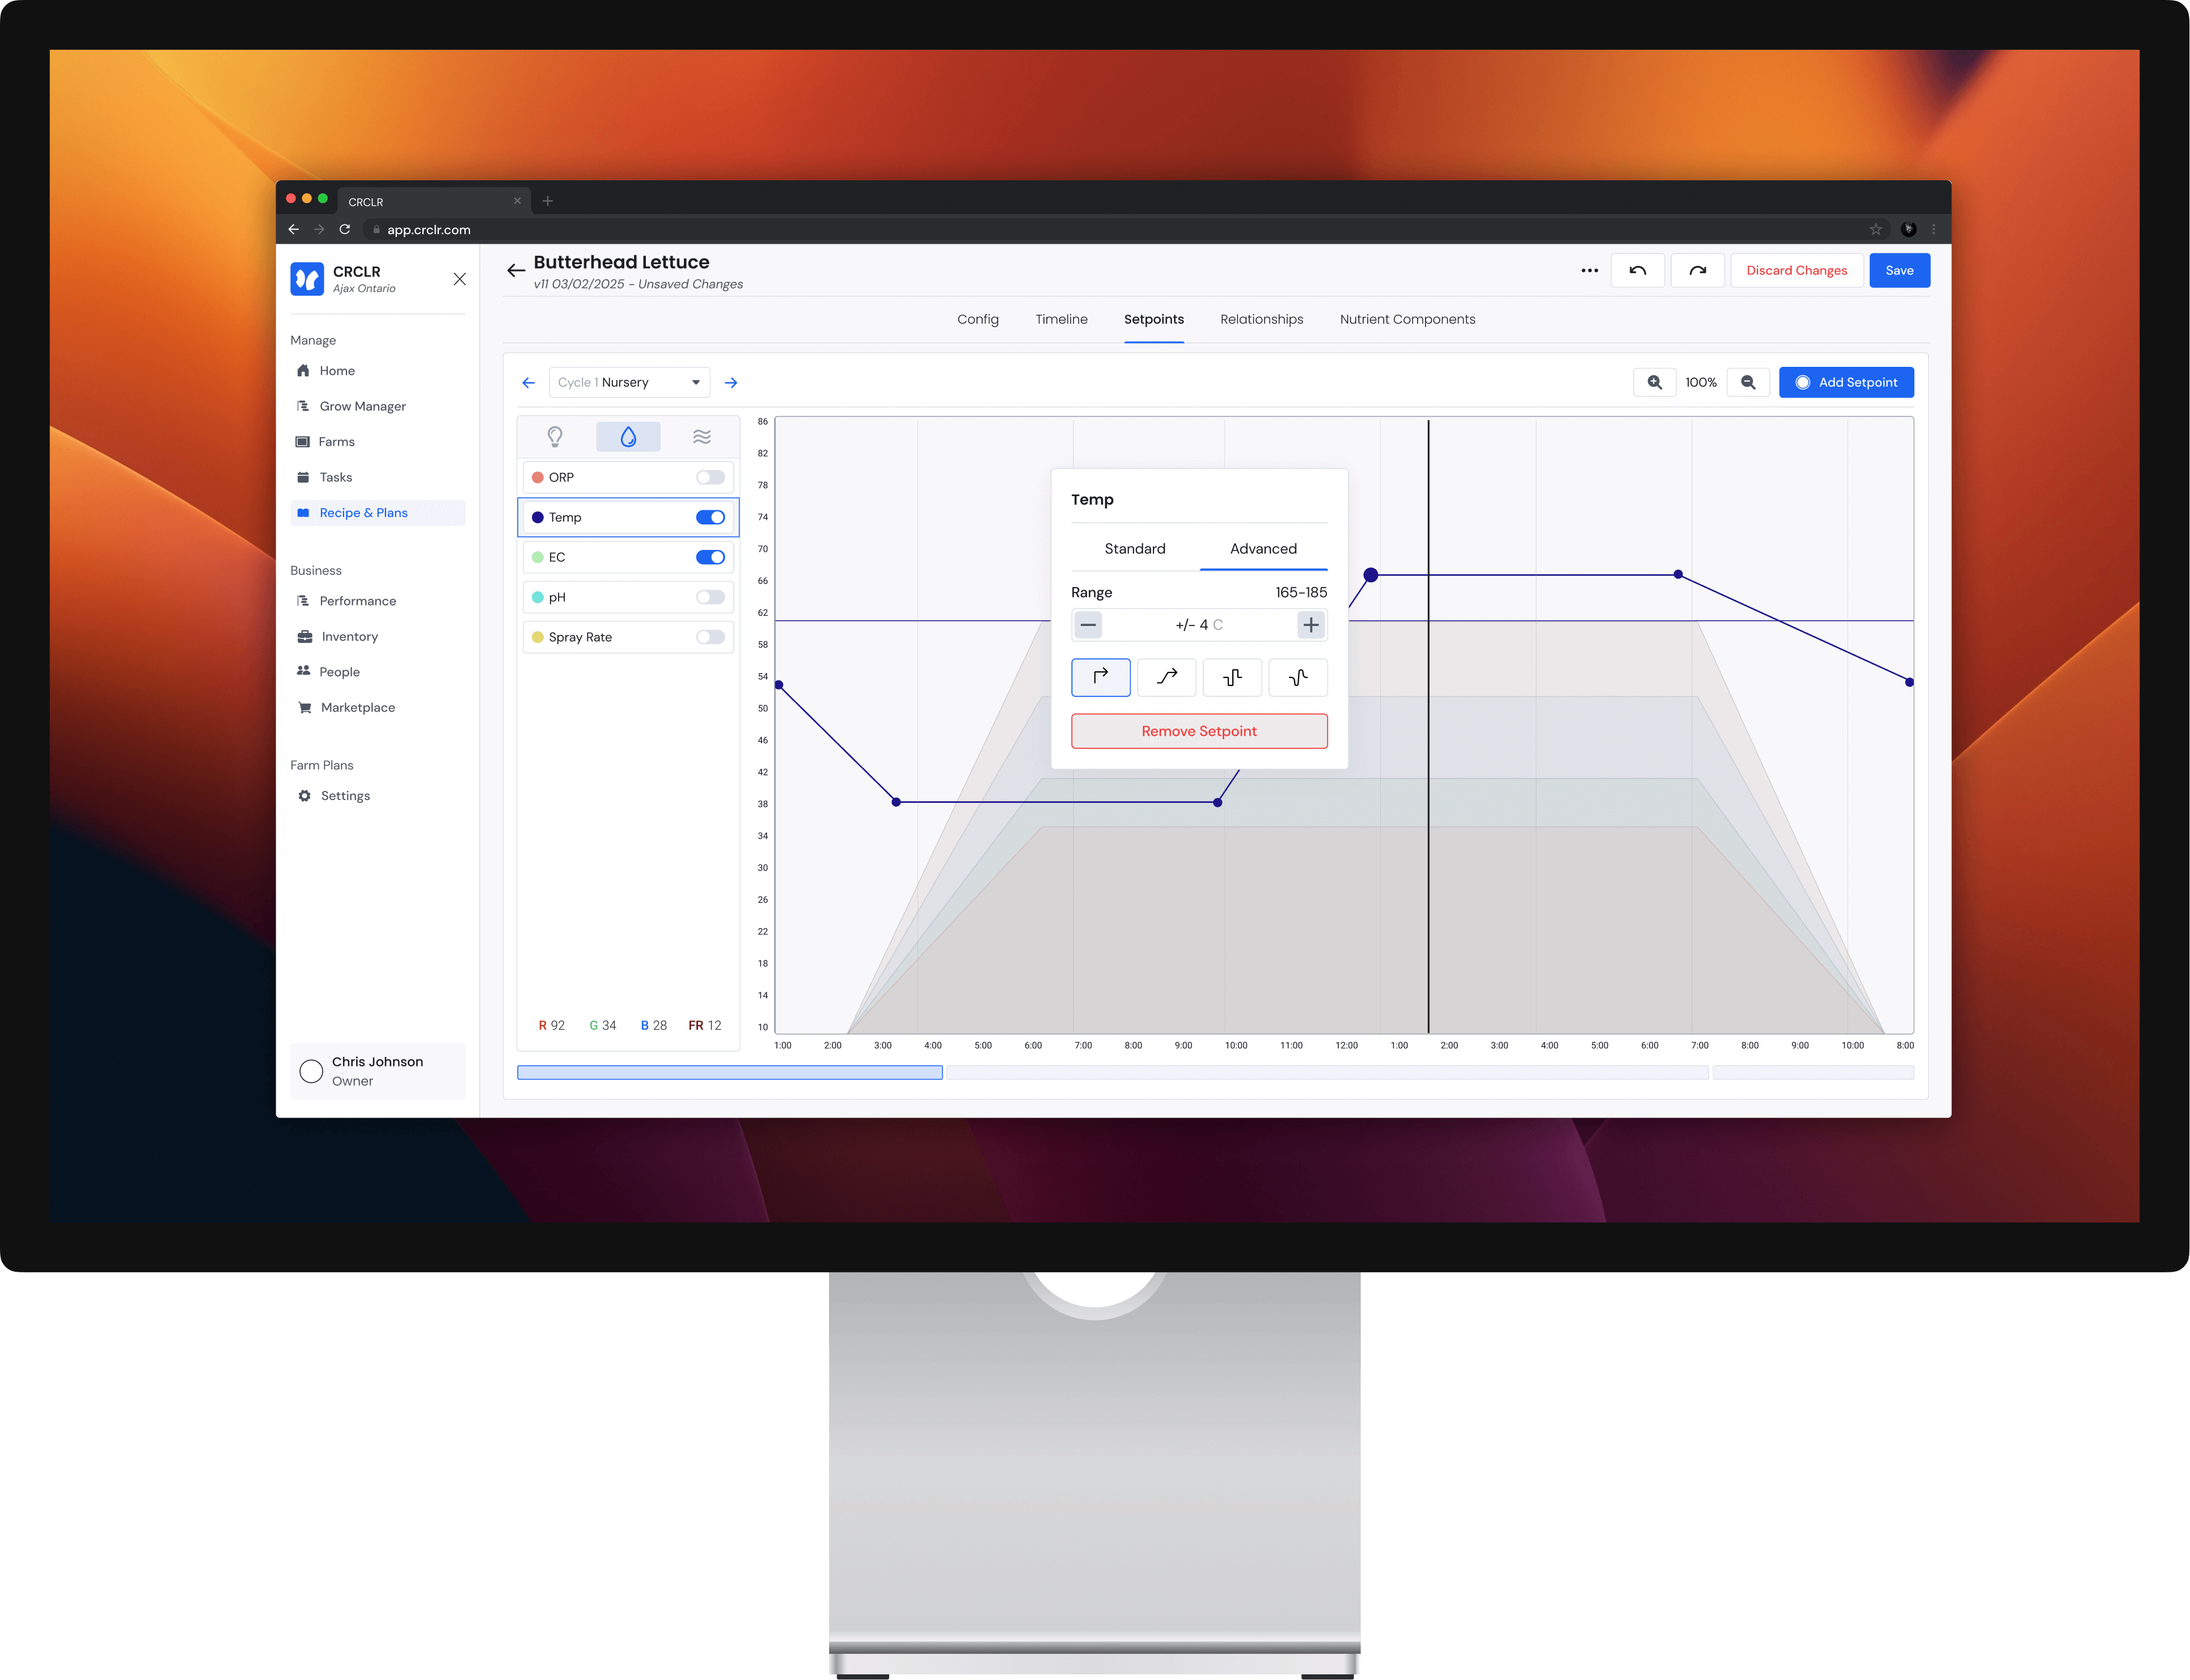
A grow zone grows plants by perfectly managing the environment in the gap between two racks. Users can set a "recipe" which essentially is a set of instruction for how the environment should be set at every stage of the plant's growth.
There are two main users the will find value from manipulating recipes, growers and plant scientists. Growers will be tweaking, reading and running the recipes while growing out their crops while plant scientists will be pushing the boundaries of the recipe's capabilities to yield new growing insights.
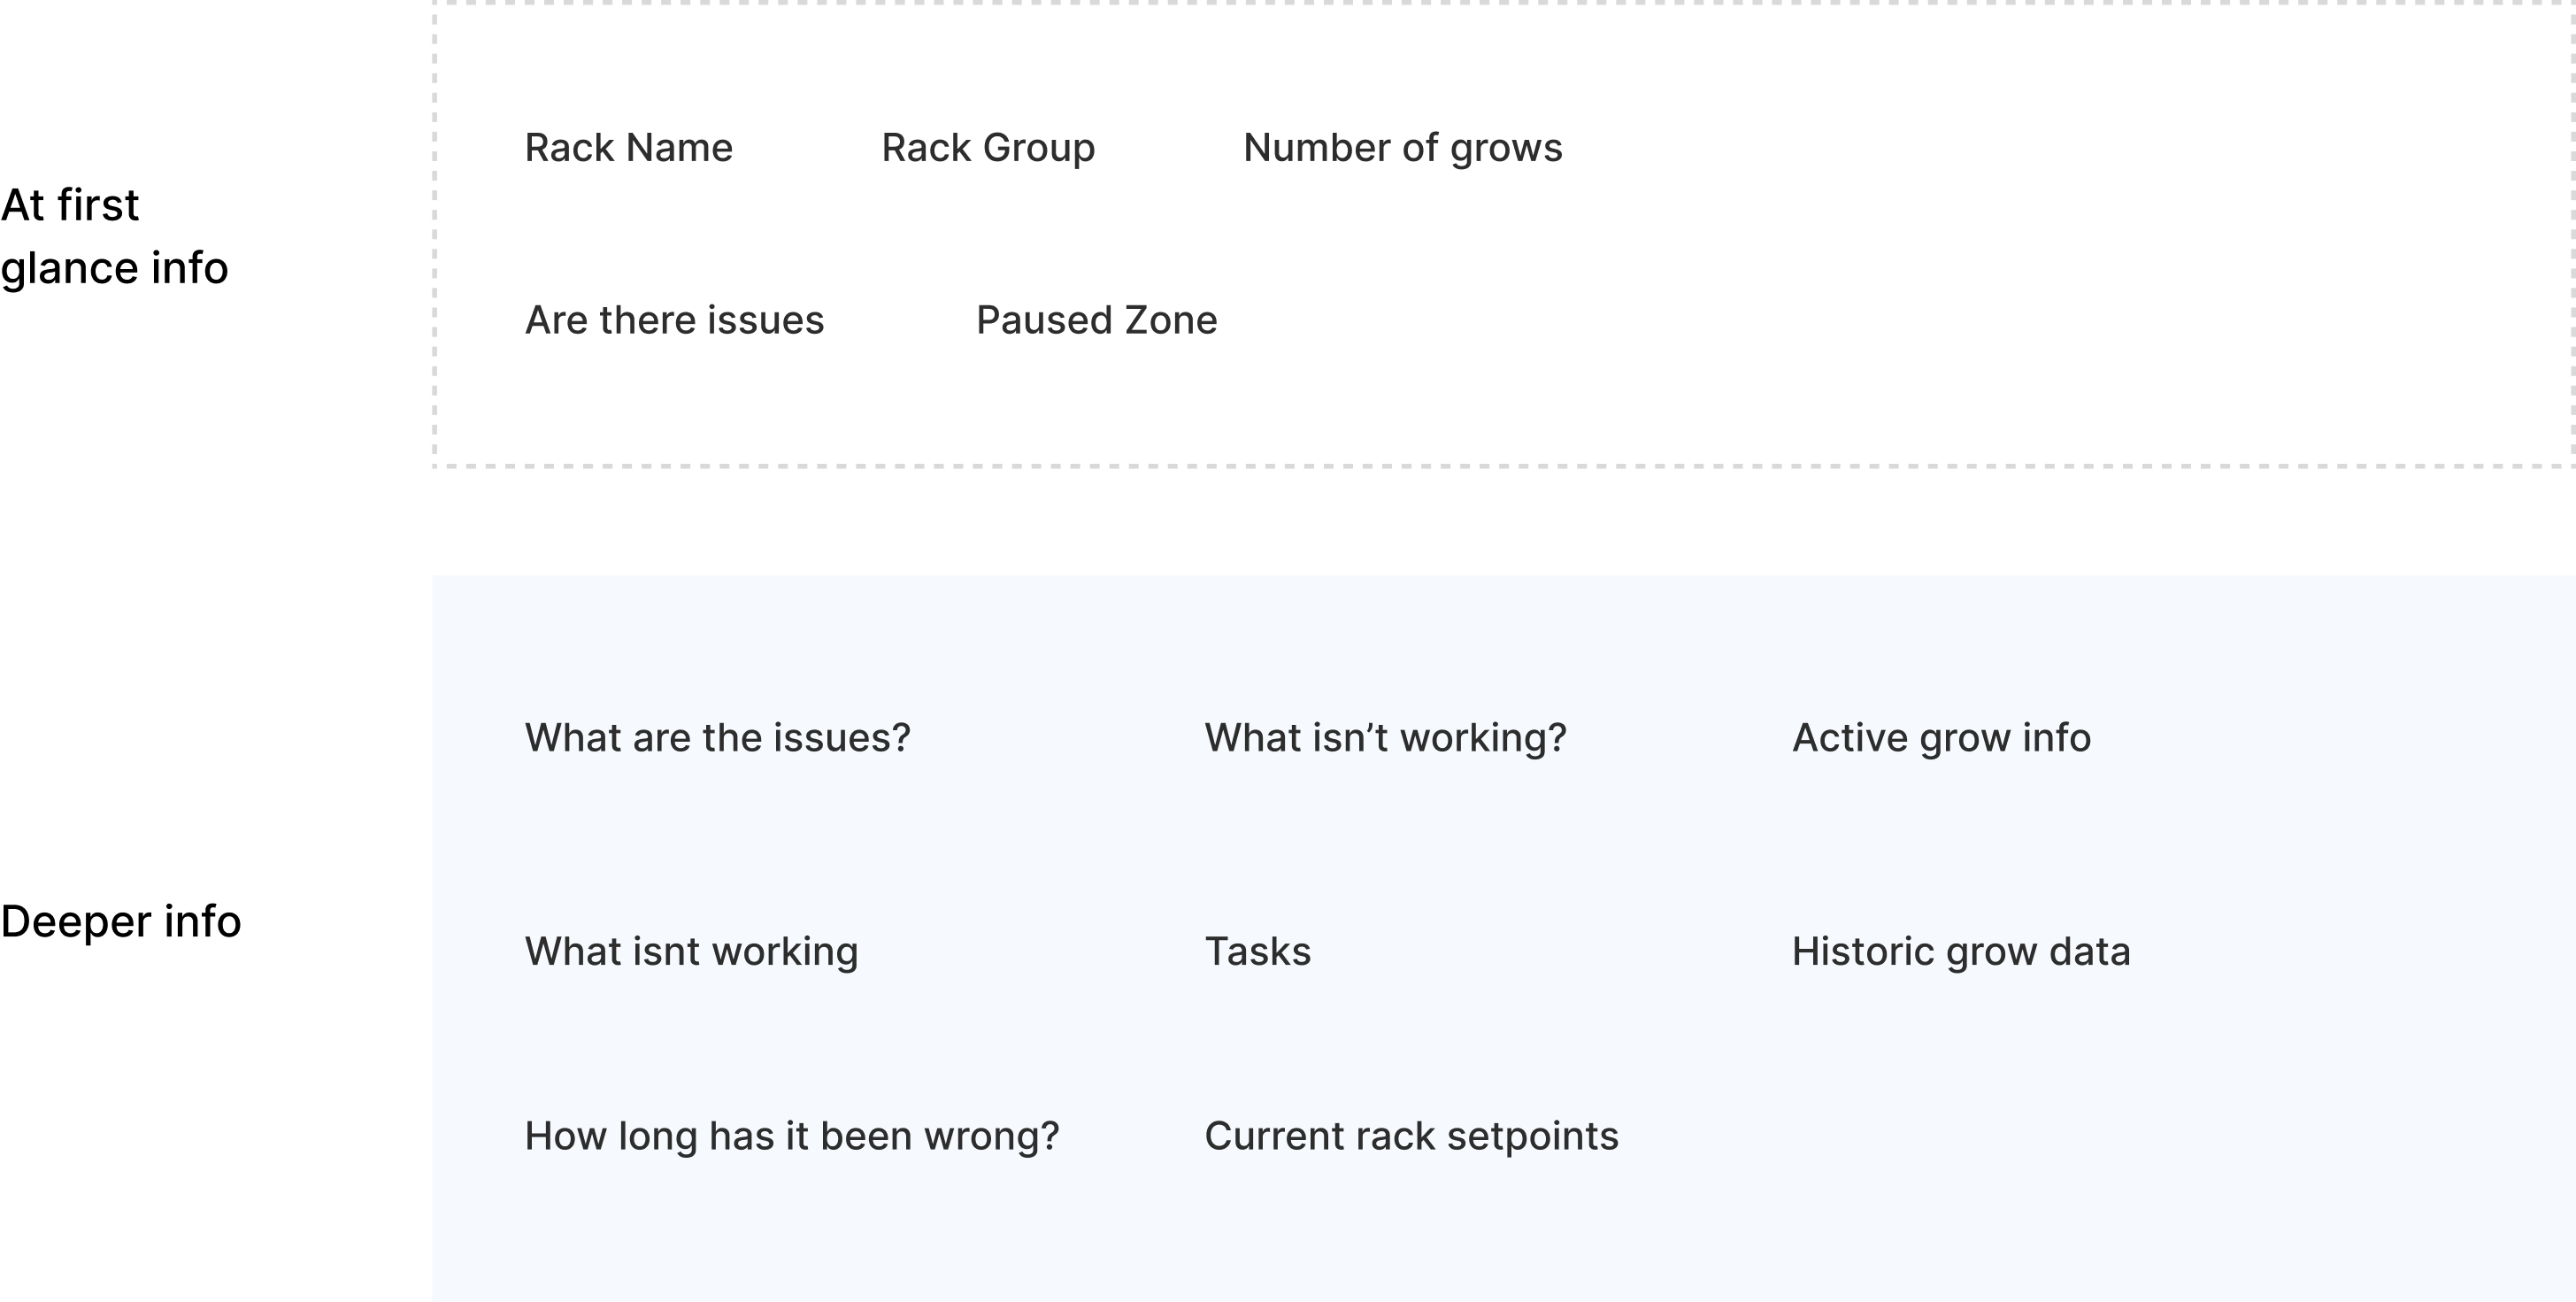
Based on discussions with farmers using our sytem, we built a list to group the ideal hierarchy of what they would look for when viewing this page. The groups are split between high priority items to be seen at a glance and more complex items that could be accessed through secondary actions.
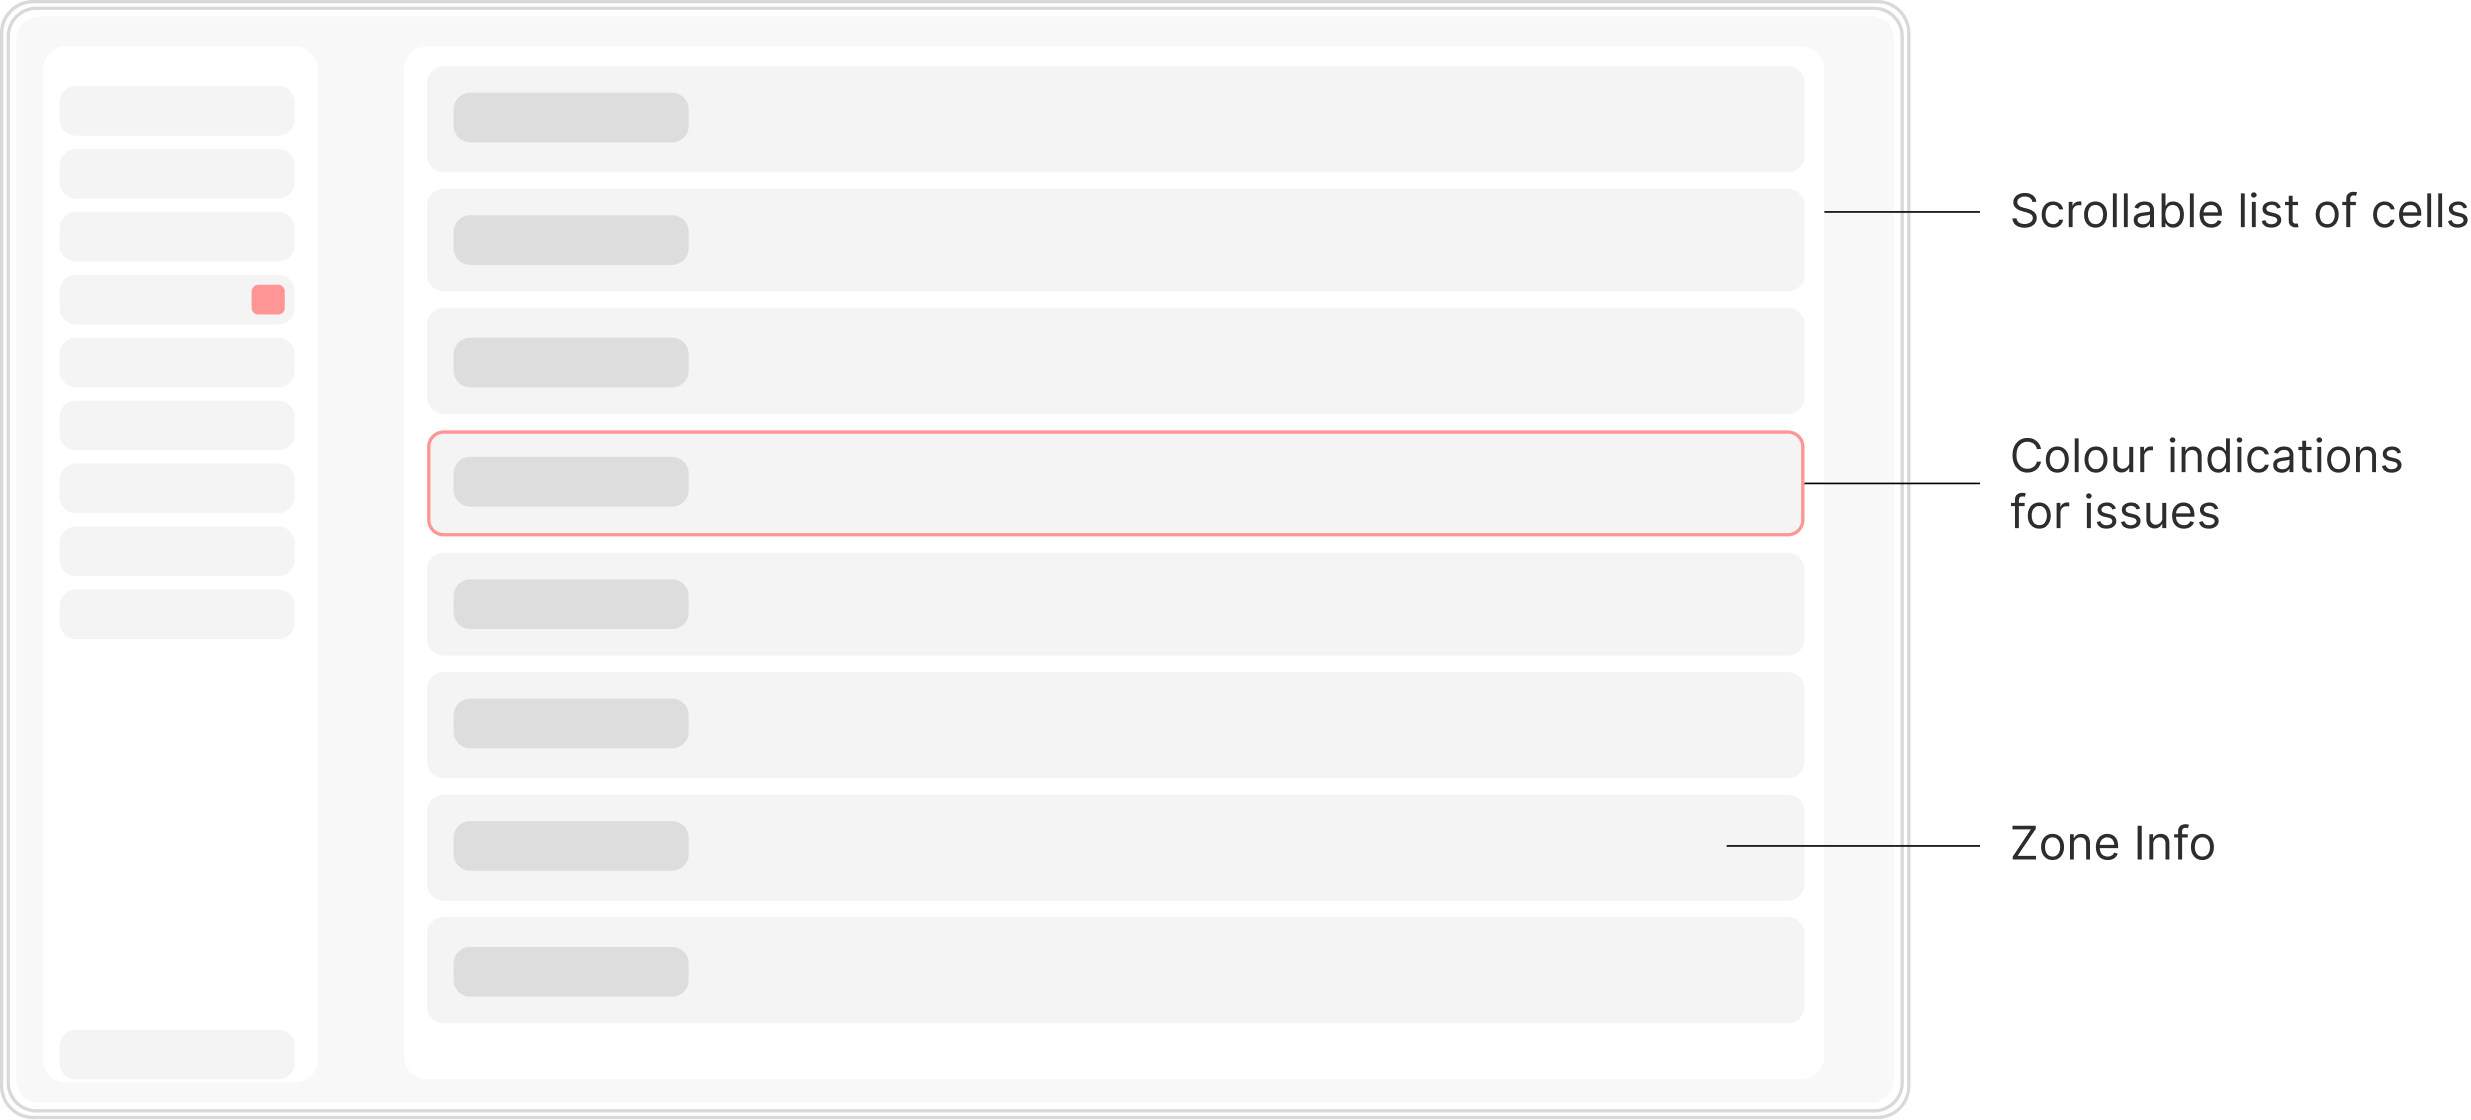
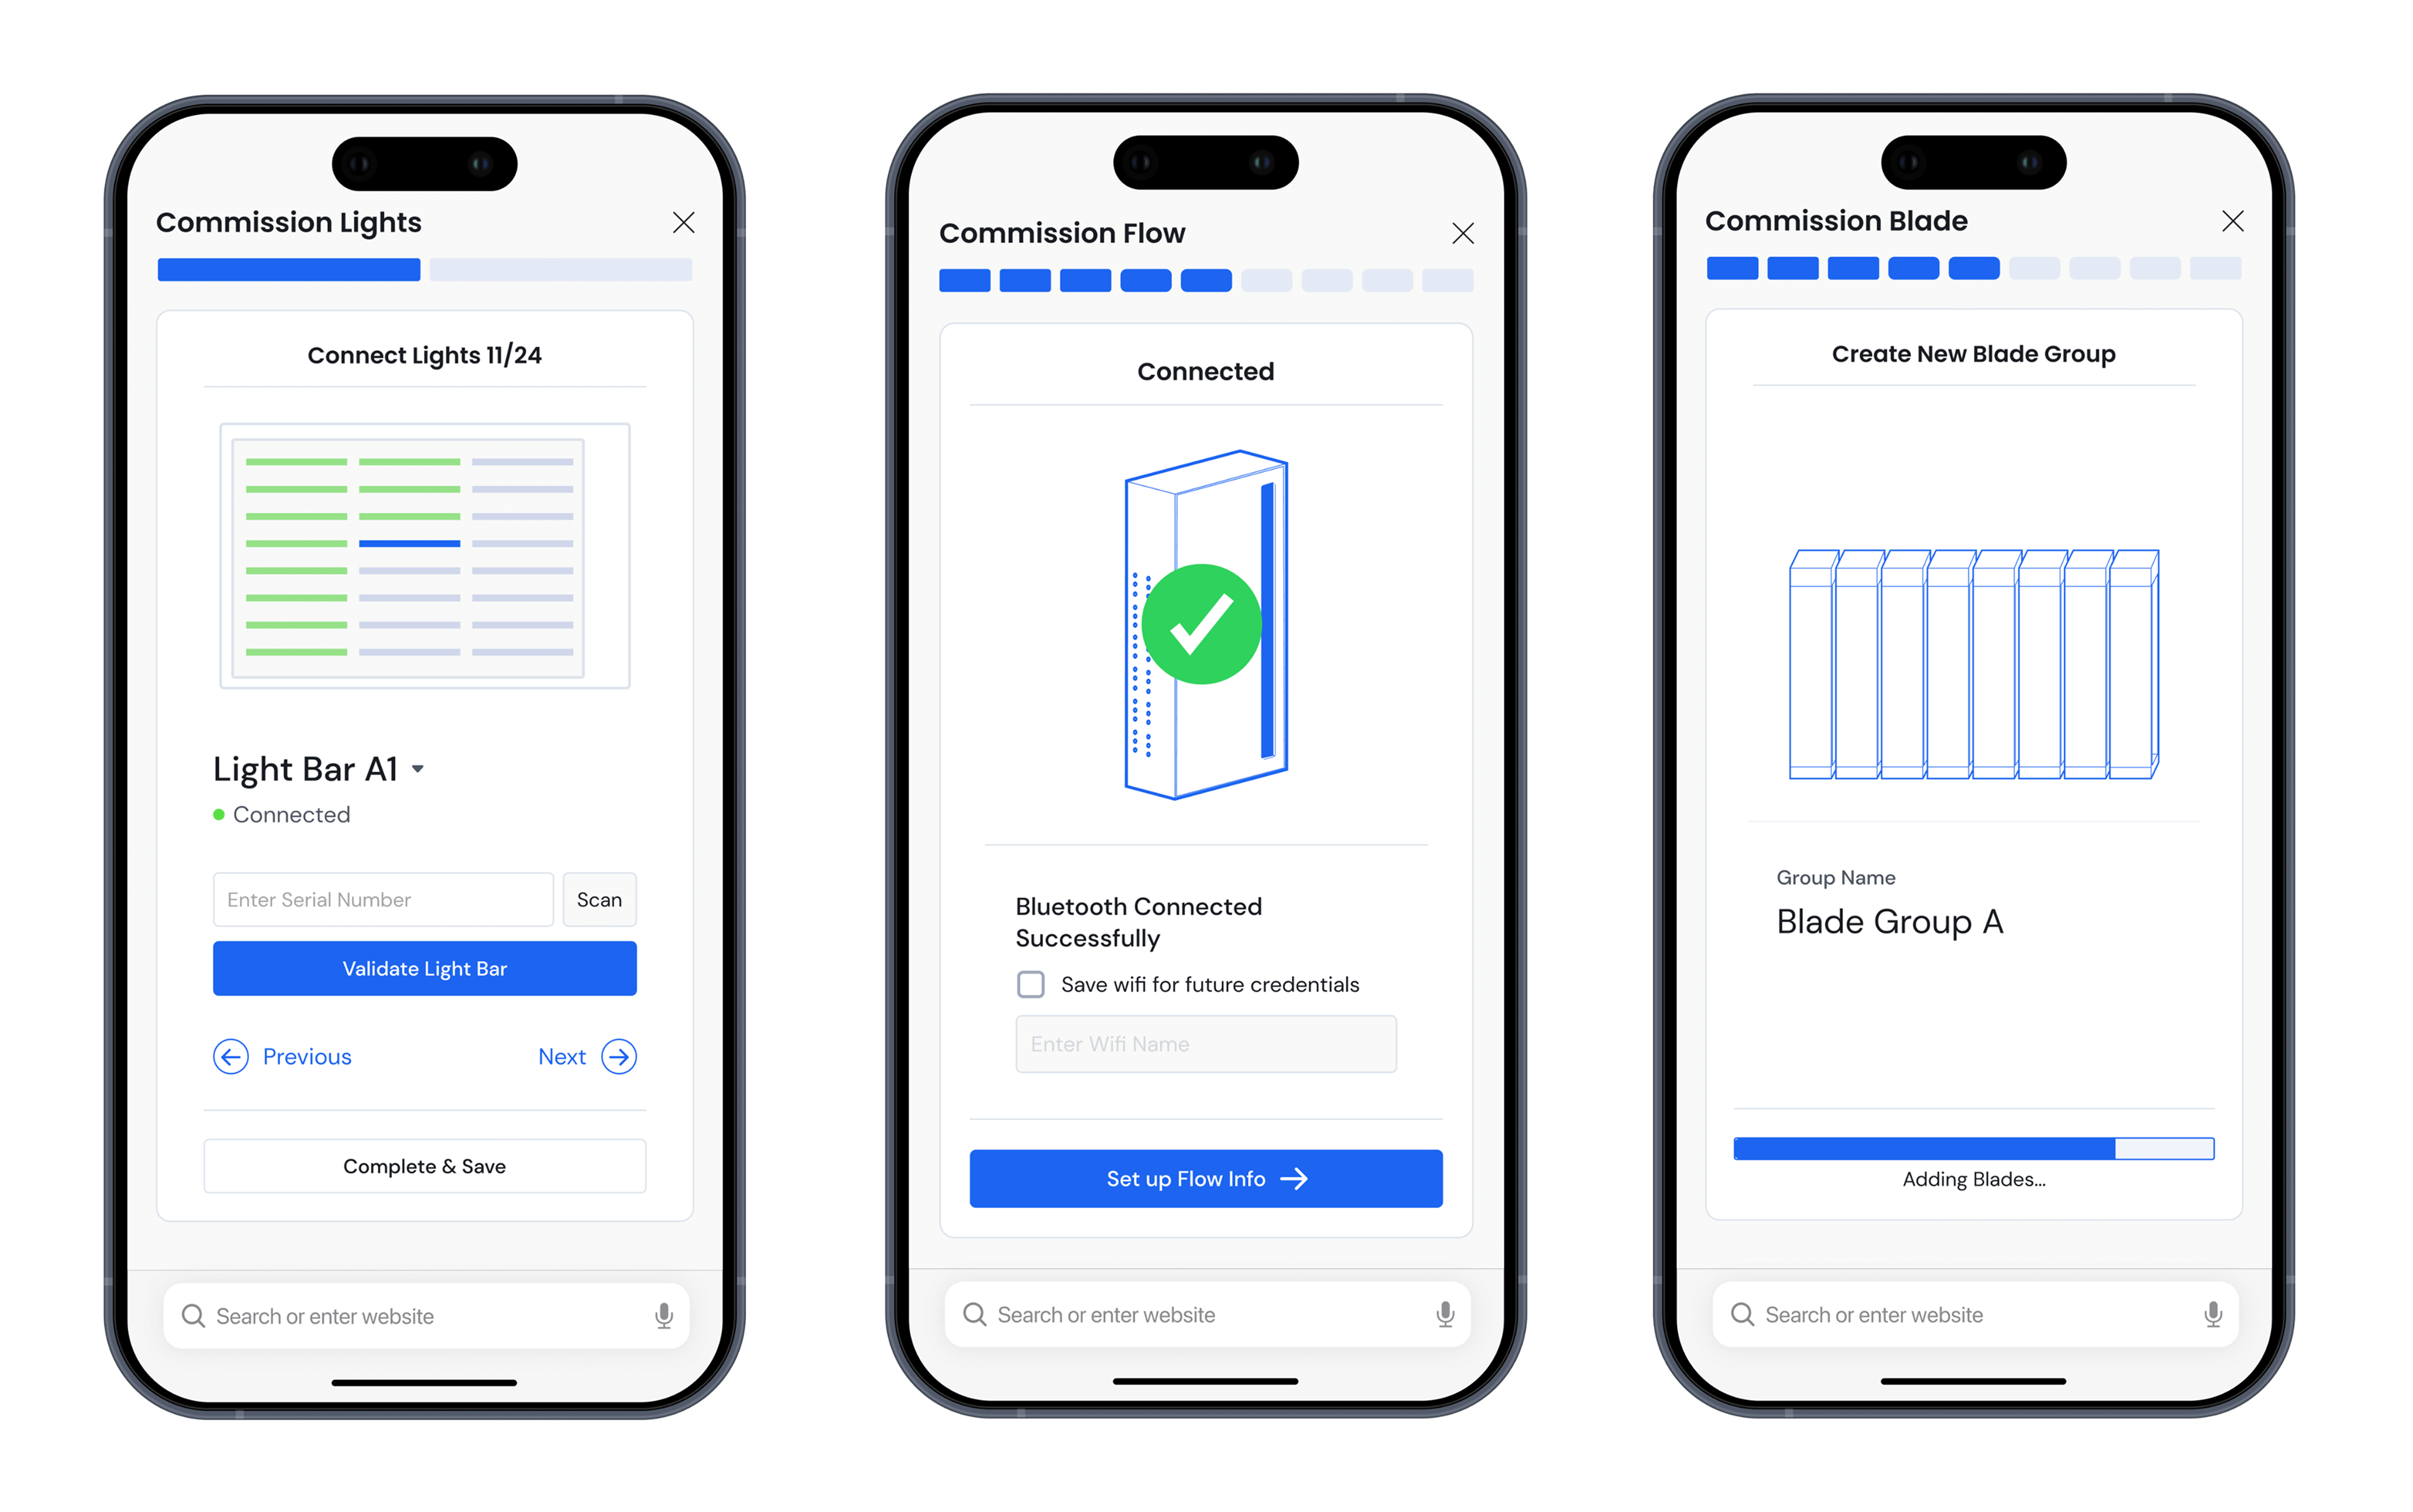
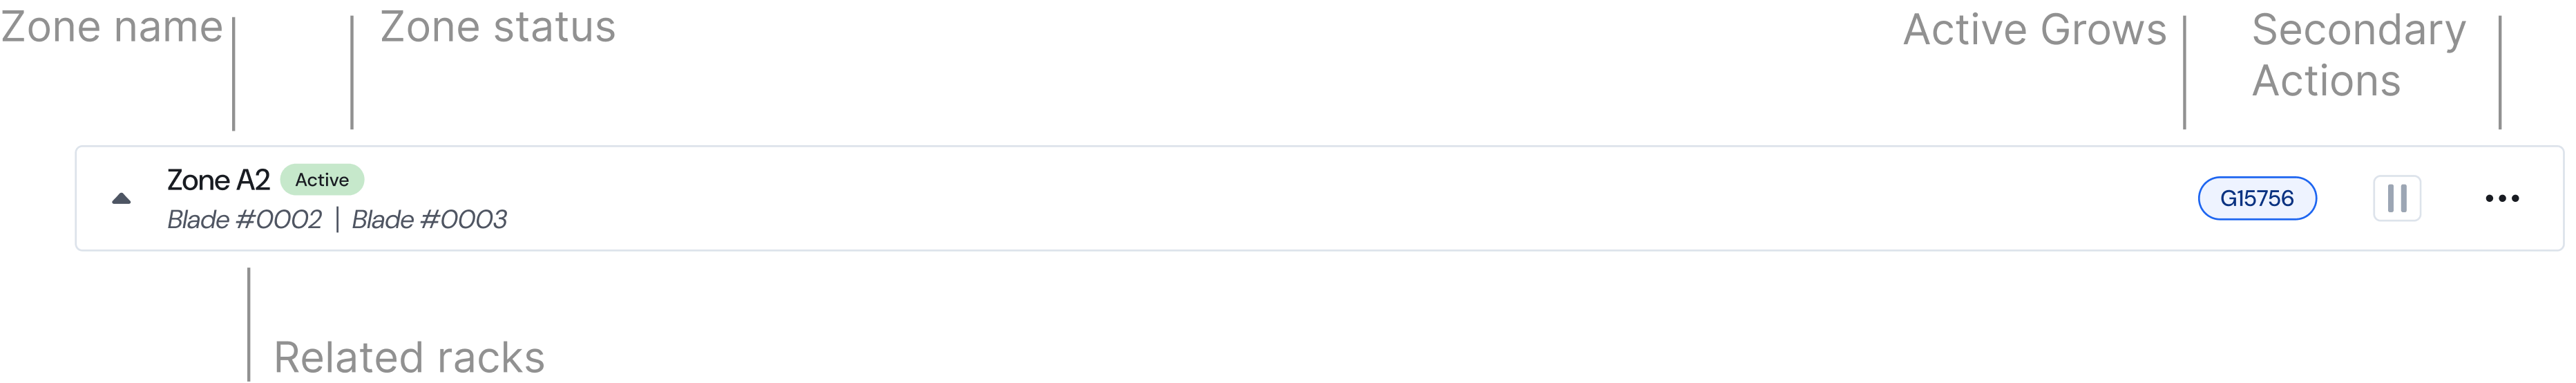
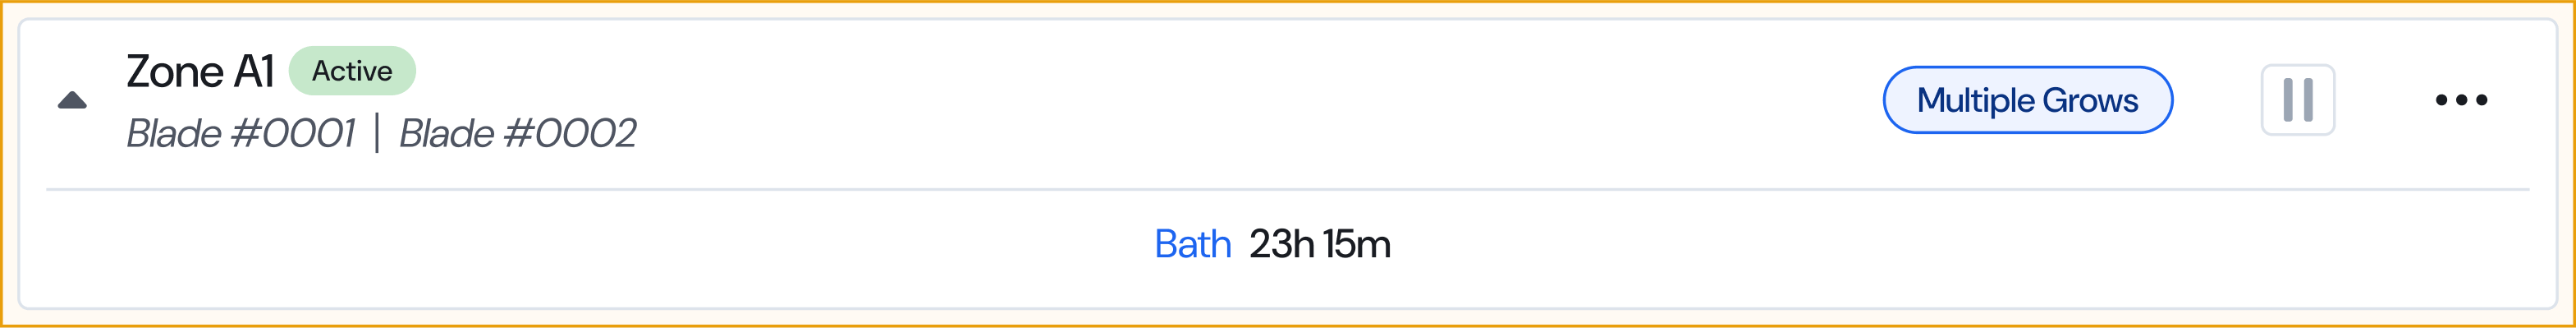
When arriving at the cell concept we experimented with some different ways of displaying the primary info into a small space. The challenge is mainly having multiple states around the current status using colour as well as dealing with potentially 100 character long names.
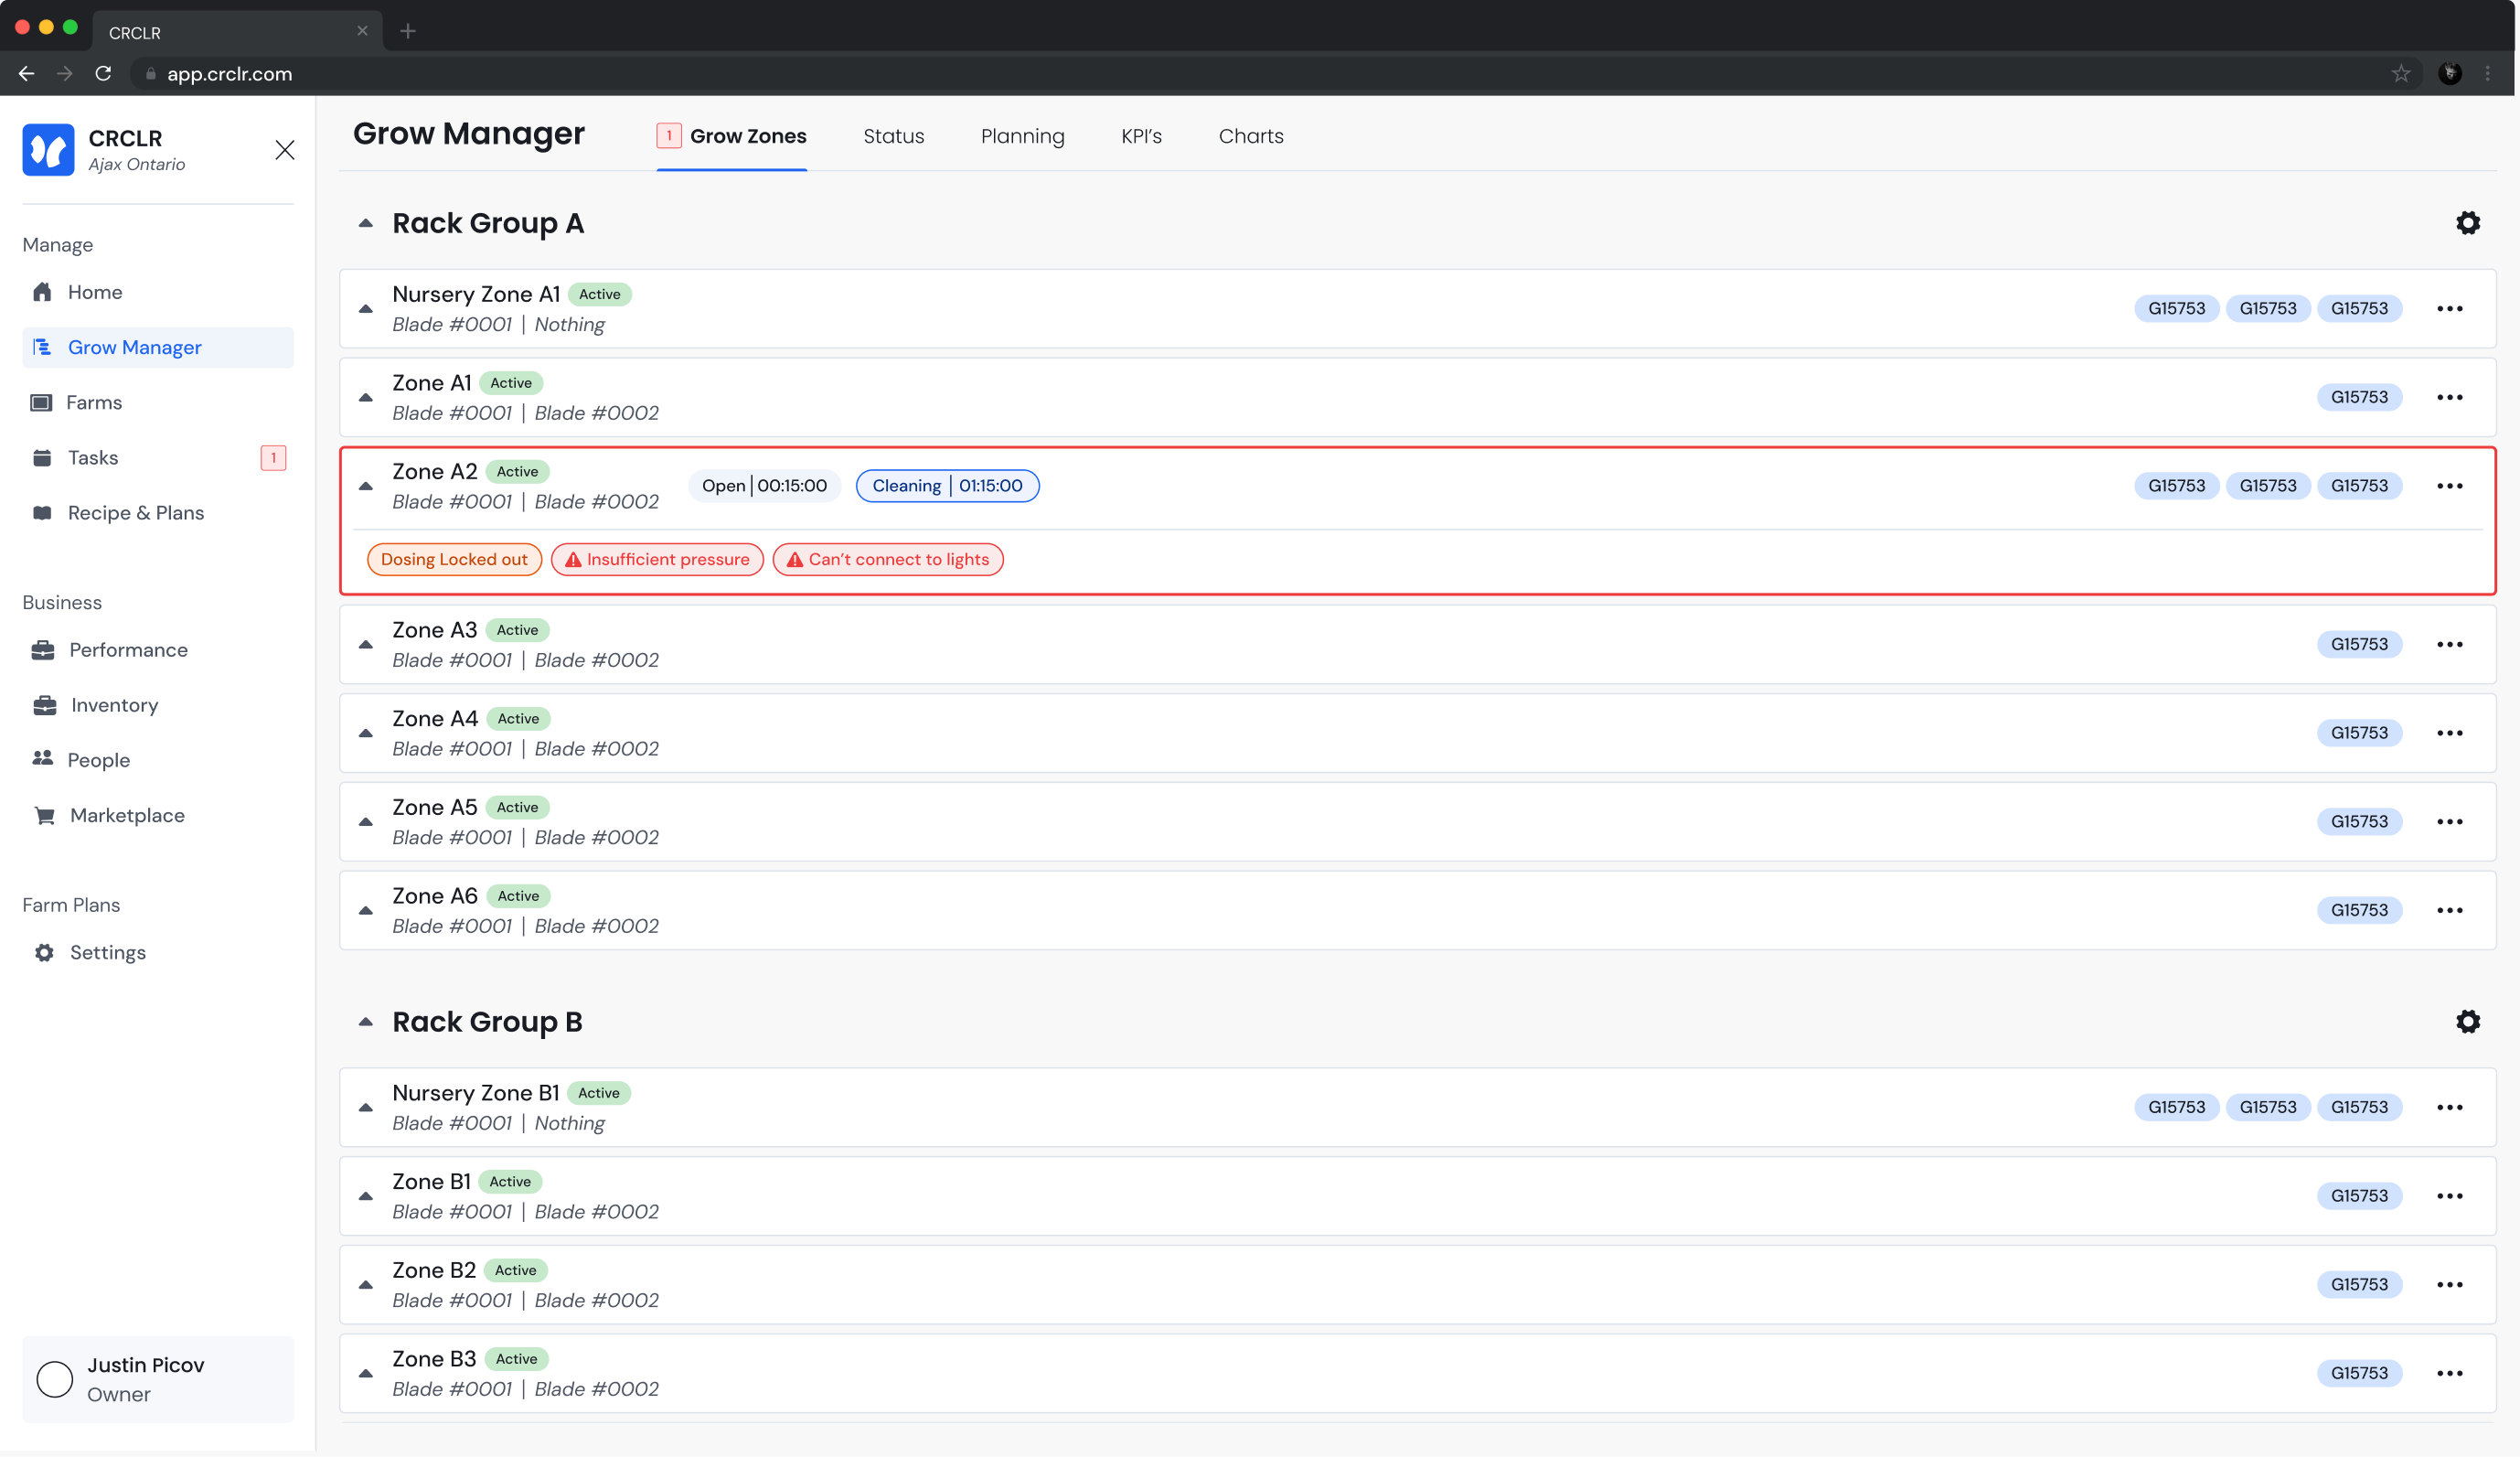
The grow zones page shows a vertical list of zone cells all contained within a "rack group". These cells show relevant active zone data the zone's name, related rack names & active grows within the zone. If something important is occurring in the zone, there will be coloured indicators along with buttons and hyperlinks.


Clicking a cell will open up more zone info organized under status, analytics & events tabs. The zone status, shows how accurately a zone is responding to ate current recipe. All relevant variables are shown visually in an organized widgets along with colourful bards when relevant.

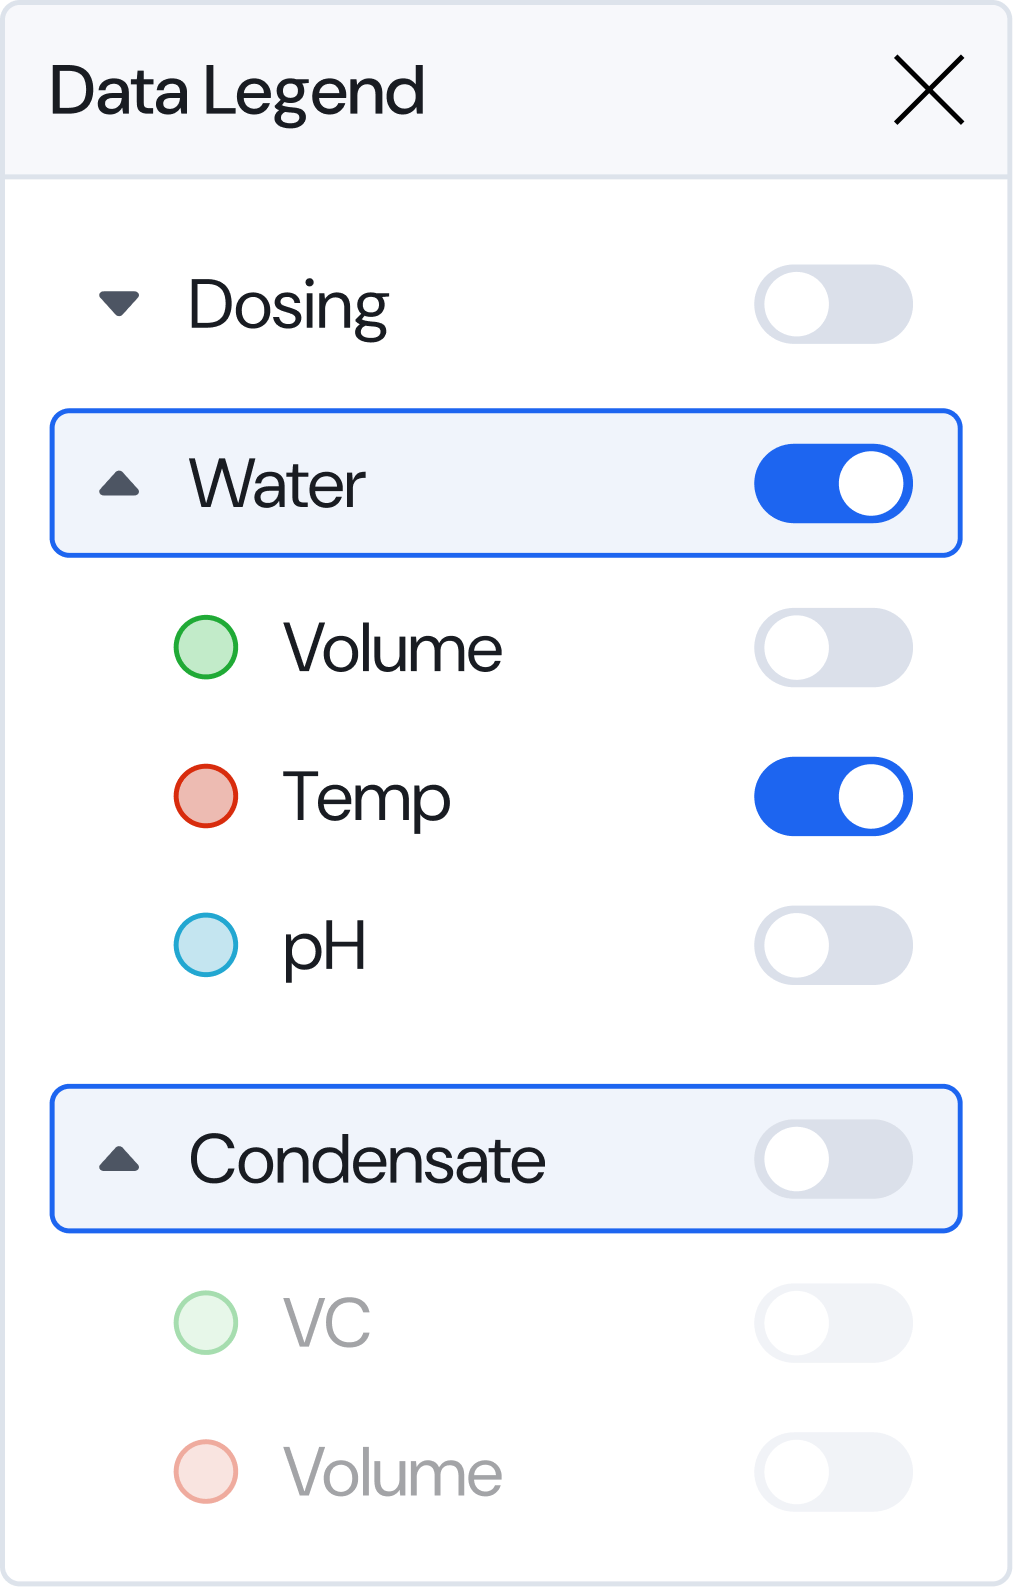
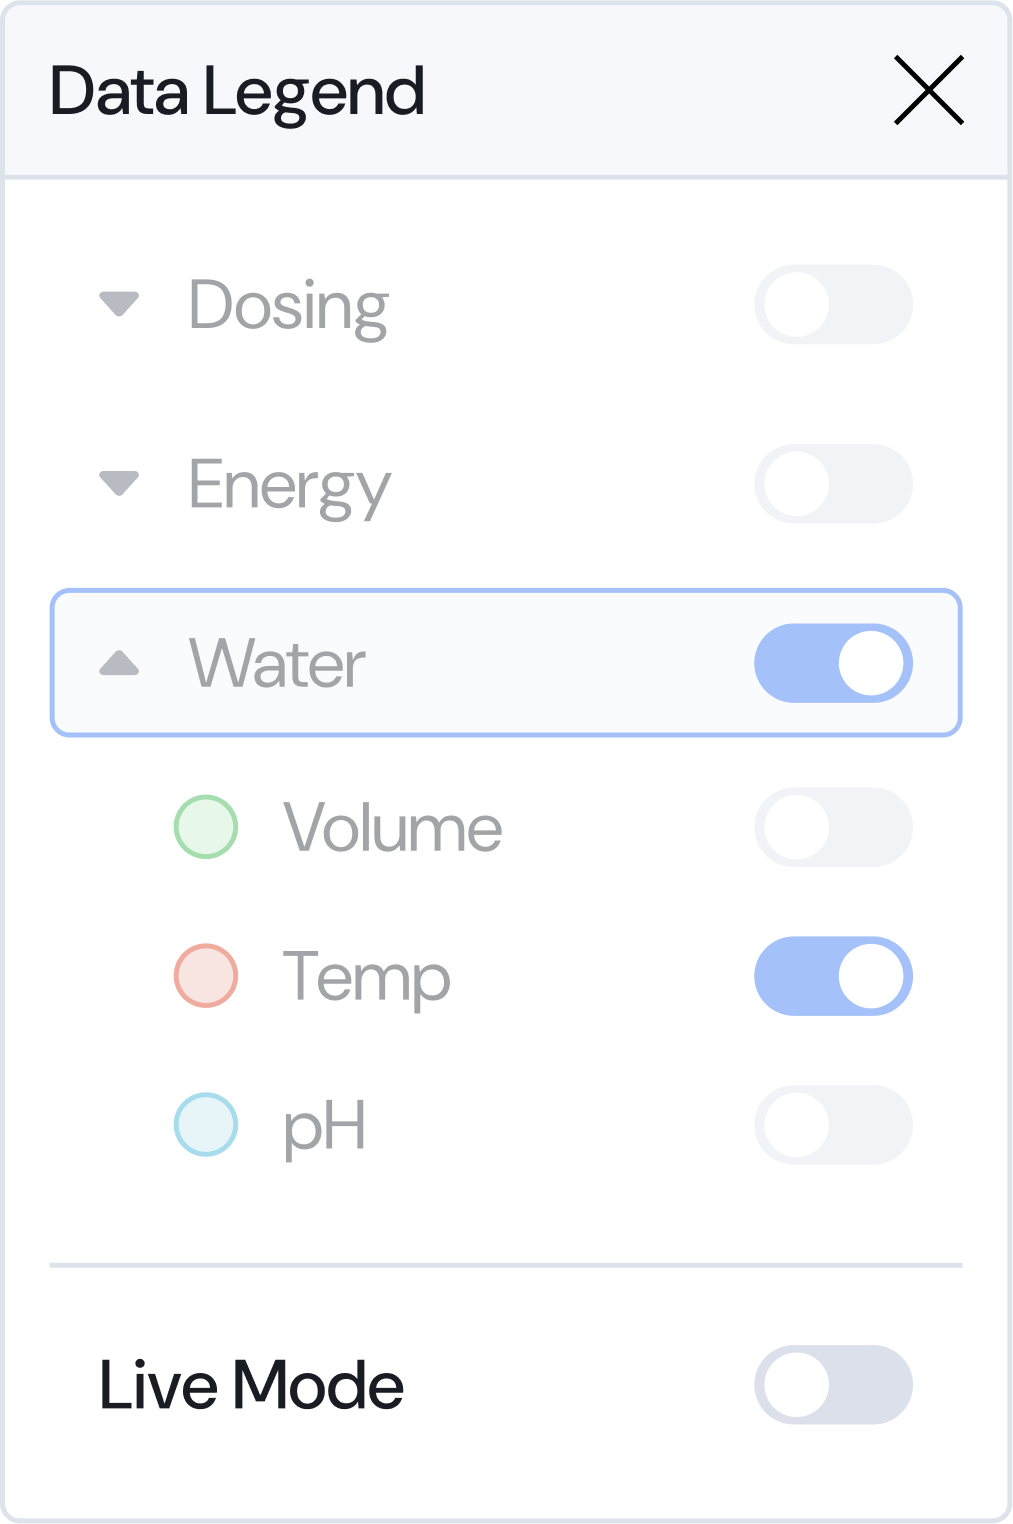
The analytics tab allows users to check back in time at how a rack was operating at a specific time range. The graphed data can be zoomed or panned to view a specific time range, allowing users to check for irregularities or issues they may have missed. Over 30 variables can be toggled on or off in the legend on the left of the graph.
The analytics tab allows users to check back in time at how a rack was operating. This allows users to check for irregularities or issues they may have missed.

A few times during testing the racks were left apart and forgotten about overnight. This resulted in poor plant lightings and was a key pain point we identified.
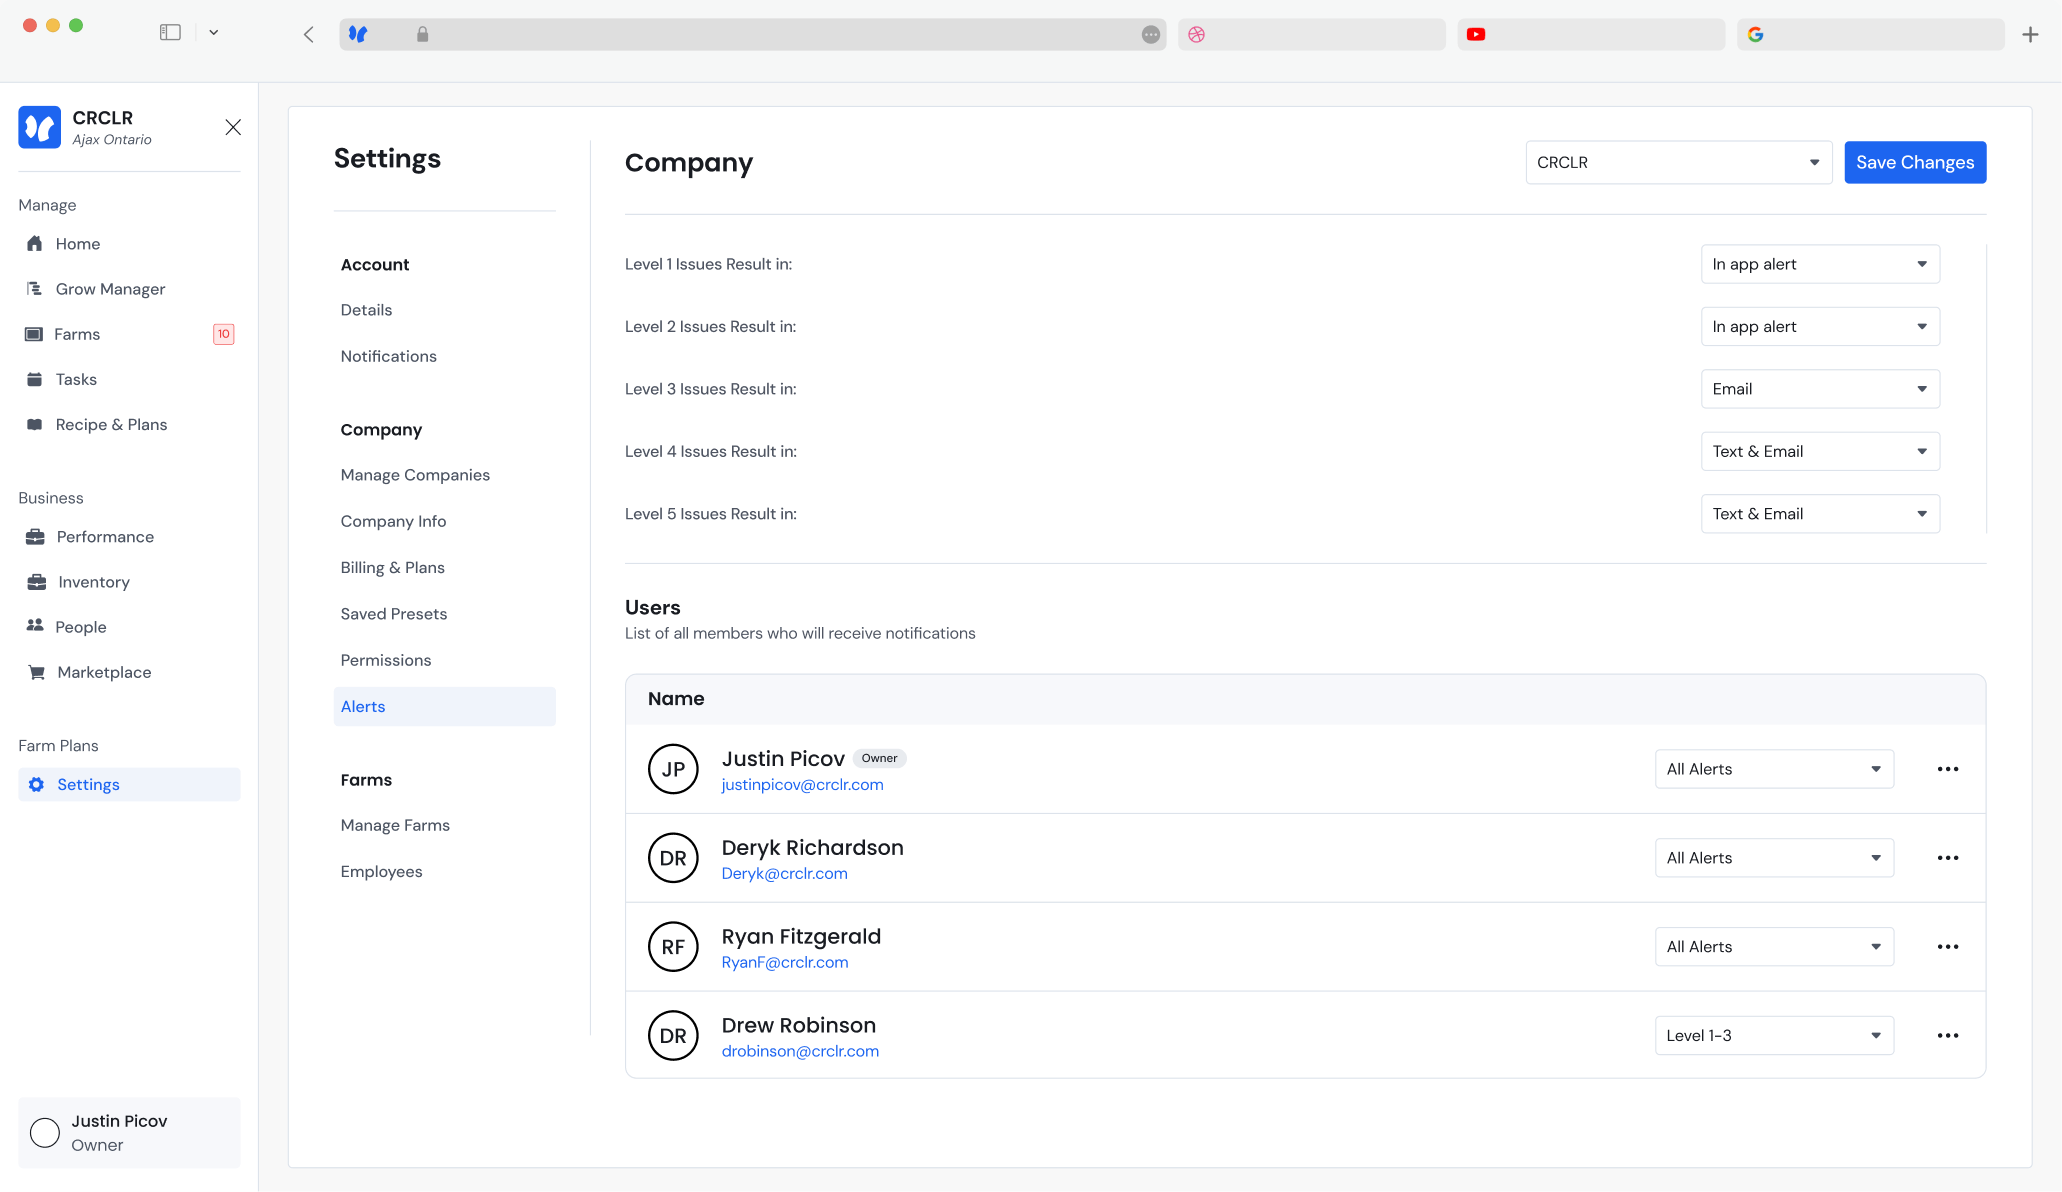
Issues were hidden behind a clickable link that just showed the number of issues. Many users reported not really checking the issues for their severity, thinking it might be a common issue
Many users also missed important issues resulting in catastrophic crop failures. Multiple requests for text notifications were received during initial testing.
There was a lot of confusion around pause mode, specifically, what features were actually paused. The timer counting down also led users to believe something was broken.